Free Online Pie Chart Maker
Create beautiful pie charts with Piktochart—no design skills needed. Transform your data into engaging visuals using our intuitive templates.

Our free pie chart tool is chosen by users worldwide


Design pie charts on the web for free
Elevate Your Data Visualization With Our Pie Chart Maker Tool
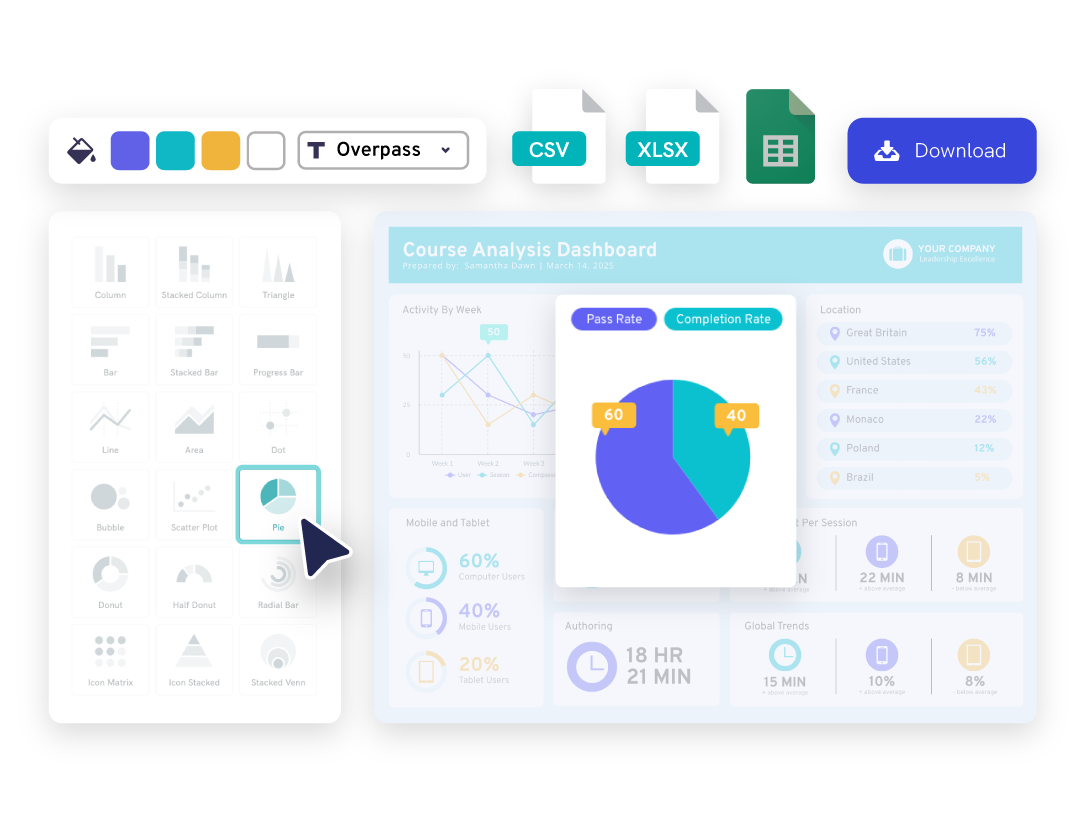
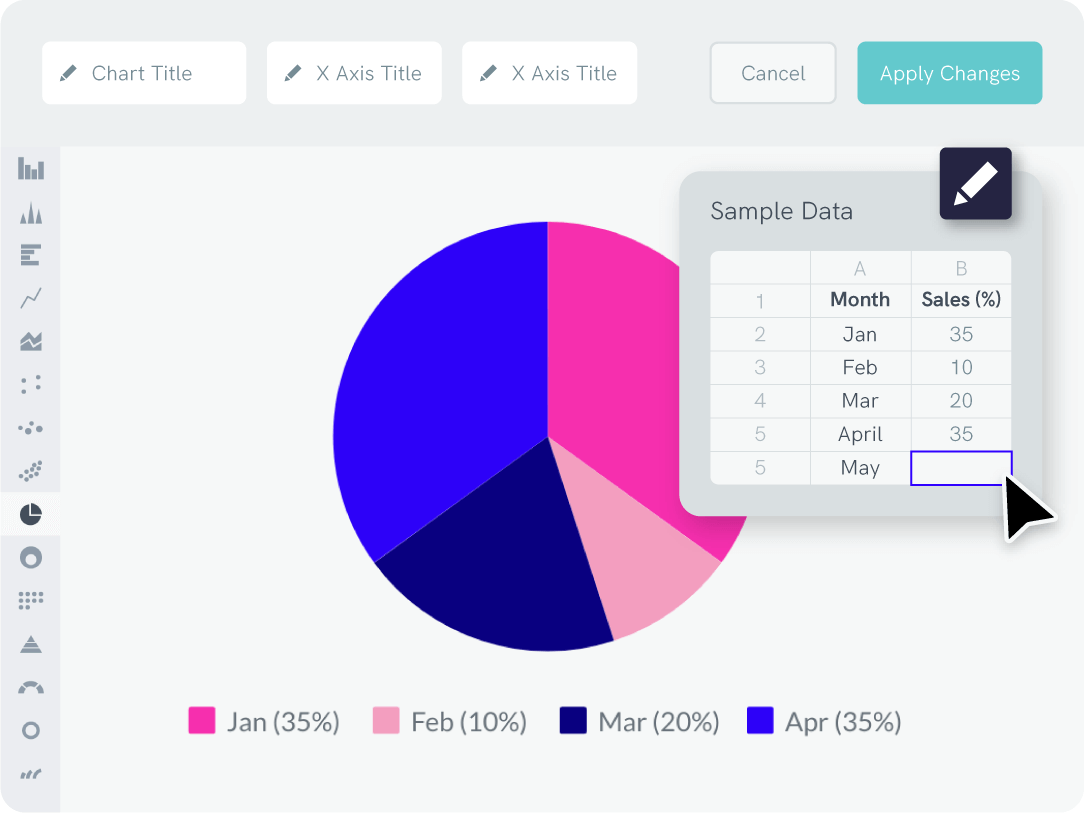
Create your own pie chart online with Piktochart and add it to presentations. Link up your Excel or Google Sheets file to easily make charts that automatically update when your data does. Combine various pie charts into one page to show progress, represent percentages, and ultimately create a professionally-looking, interactive dashboard to share with your stakeholders.
Branding through our pie chart maker
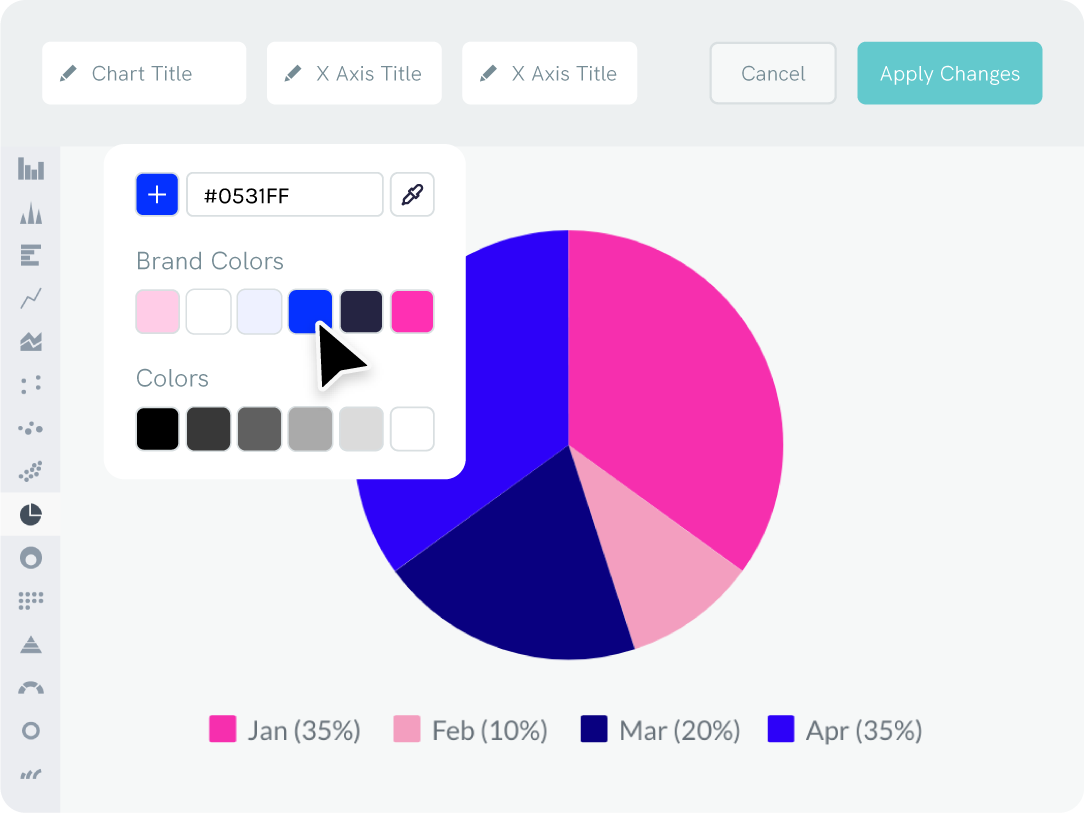
Change the Colors of Your Pie Chart to Match Your Brand
Want to use your company’s fonts (or even icons) in the pie chart or doughnut charts? Easy as pie.
Just drag your logo or a screenshot of your website to extract your brand colors automatically. Your custom color palette and uploaded fonts will always be accessible in Piktochart’s pie chart maker and editor.
How to Create a Pie Chart
Log in
Create an account or log into Piktochart.
Pick a pie chart template
Pick a pie chart template made by designers or start from scratch.
Open the pie chart maker
Go to tools and open up our pie chart maker.
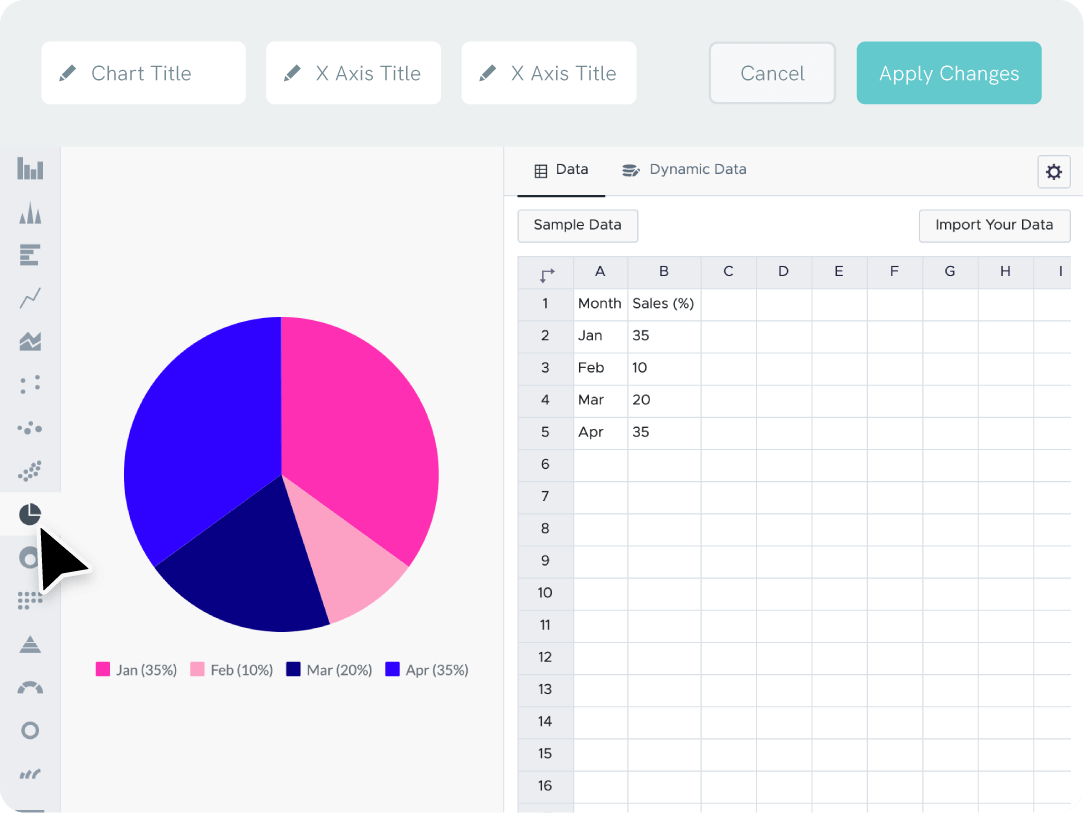
Enter your data points
Start editing. Copy-paste your data points straight from Excel or CSV, or link a Google Sheet.
Adjust to your liking
Change data labels, percentages, x-axis, y-axis, graph title, background color, and more.
Download or share
Download your finished pie chart as a JPG, PNG, or PDF file, or share your graphic on social media.
Content creation tool for design assets
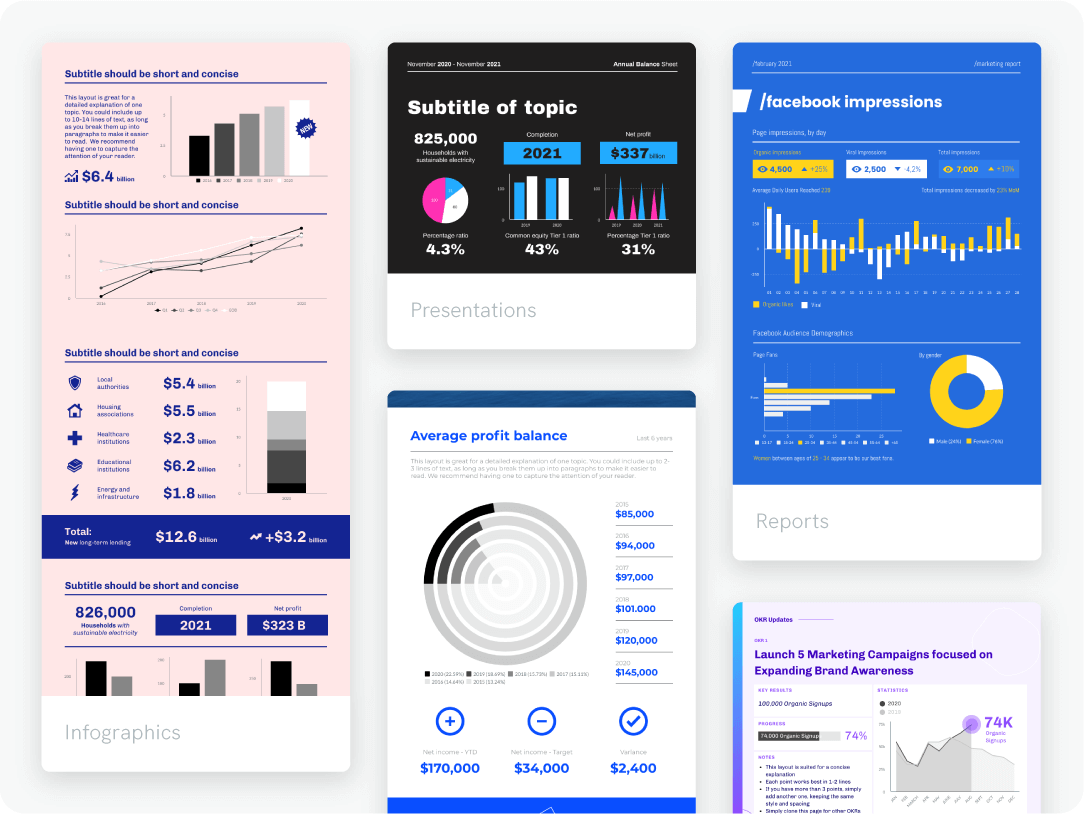
Add Your Pie Chart Graph to Any Format
With Piktochart’s online pie chart maker, you can easily make reports, presentations, infographics (and more) that tells your story with great visuals.
Our tool is so simple that you can immediately use it without any background in design. Start with a pie graph template designed by experts or design a graphic from scratch. When it’s ready, easily share it with one click or download it as an image file or a PDF.
Repurposing pie charts
Make a Pie Chart and Reuse It
No need to spend hours re-creating the same assets every month. Make the perfect visual and use it multiple times. You can change illustrations, upload your own images, add raw data, edit the chart title, and customize all design elements quickly with Piktochart.
Organize your templates and past projects in folders. Make it easy for anyone on your team to repurpose pie charts online.
Templates to use a pie chart in


Ready to create beautiful pie charts?
Join more than 14 million people who already design information with Piktochart’s free pie chart maker.
FAQs
- Use software or tools that allow you to make charts easily (Excel is great and a classic, while Piktochart helps you have a great design for your pie charts, bar charts, donut charts, and more).
- Choose data that lends itself well to a pie chart.
- Keep your presentation design simple.
- Double-check all details. Ensure your data values are accurate and your labels are clear and easy to read.
- Save time and customize a pre-made report template.
- Following these tips lets you design and download graphs quickly.
- Choose the right tool depending on your needs (Excel for complex data, Piktochart to create nicely-designed charts, Google Spreadsheet for collaboration).
- Use accurate data values.
- Keep your graphs simple.
- Customize as needed. When using an online design tool like Piktochart, you can choose the background, illustrations, icons, and other design elements with one click from the menu.
Chart Resources