Although ChatGPT is growing its abilities daily, it can’t be all things at all times for all people.
Generative AI and LLMs do a lot of things but none of them particularly well, which isn’t necessarily a problem if you don’t depend on them daily for important professional tasks.
For a related read, see our guide on nano banana prompts use cases.
However, if you’re someone who needs to create infographics, presentations, or reports regularly, you need a more specialized design tool.
Jack of all trades, master of none
ChatGPT is the go-to for everything.
From writing essays to giving relationship advice to drawing living room interior design schematics, ChatGPT seems like a one-stop shop for our needs.
While ChatGPT is really good at doing a lot of things from a broad strokes perspective, it sometimes stumbles when it comes to the nitty gritty details, which can sometimes make or break a project.
When it comes to professional work, though, can ChatGPT really do everything perfectly, especially when it comes to detailed or creative tasks?
Regular users can create essays, images, reports, and infographics using ChatGPT. With the right prompts (and subscriptions to ChatGPT Pro or Plus), ChatGPT can help you create videos too.
If you have a report or visual image due in a couple of hours, you may be tempted to use ChatGPT to create any of the above for you.
You might also find our article on what is nano banana useful.
After all, the basic version of ChatGPT acts like an easy, free design tool.
With the right prompts, ChatGPT can come up with what you need quickly, on demand, and with no design experience required.
But, can ChatGPT really produce reports and infographics that are business-ready right out of the box?
We’re going to find out.
Why Use AI Design Tools Instead
Generative AI and the capabilities of Large Language Models (LLMs) have come a long way in the last few years and continue to improve at an impressive pace.
However, they haven’t quite caught up to the polished and enhanced quality of life features dedicated design tools offer.
Dedicated design tools like Piktochart and Canva can produce more professional reports, presentations, social media images, and infographics compared to generative AI and LLMs.
That’s why despite ChatGPT seemingly being able to do everything, people still subscribe to design platforms like Piktochart due to their features that make it intuitive to design and customize your documents, templates, reports, and presentations.
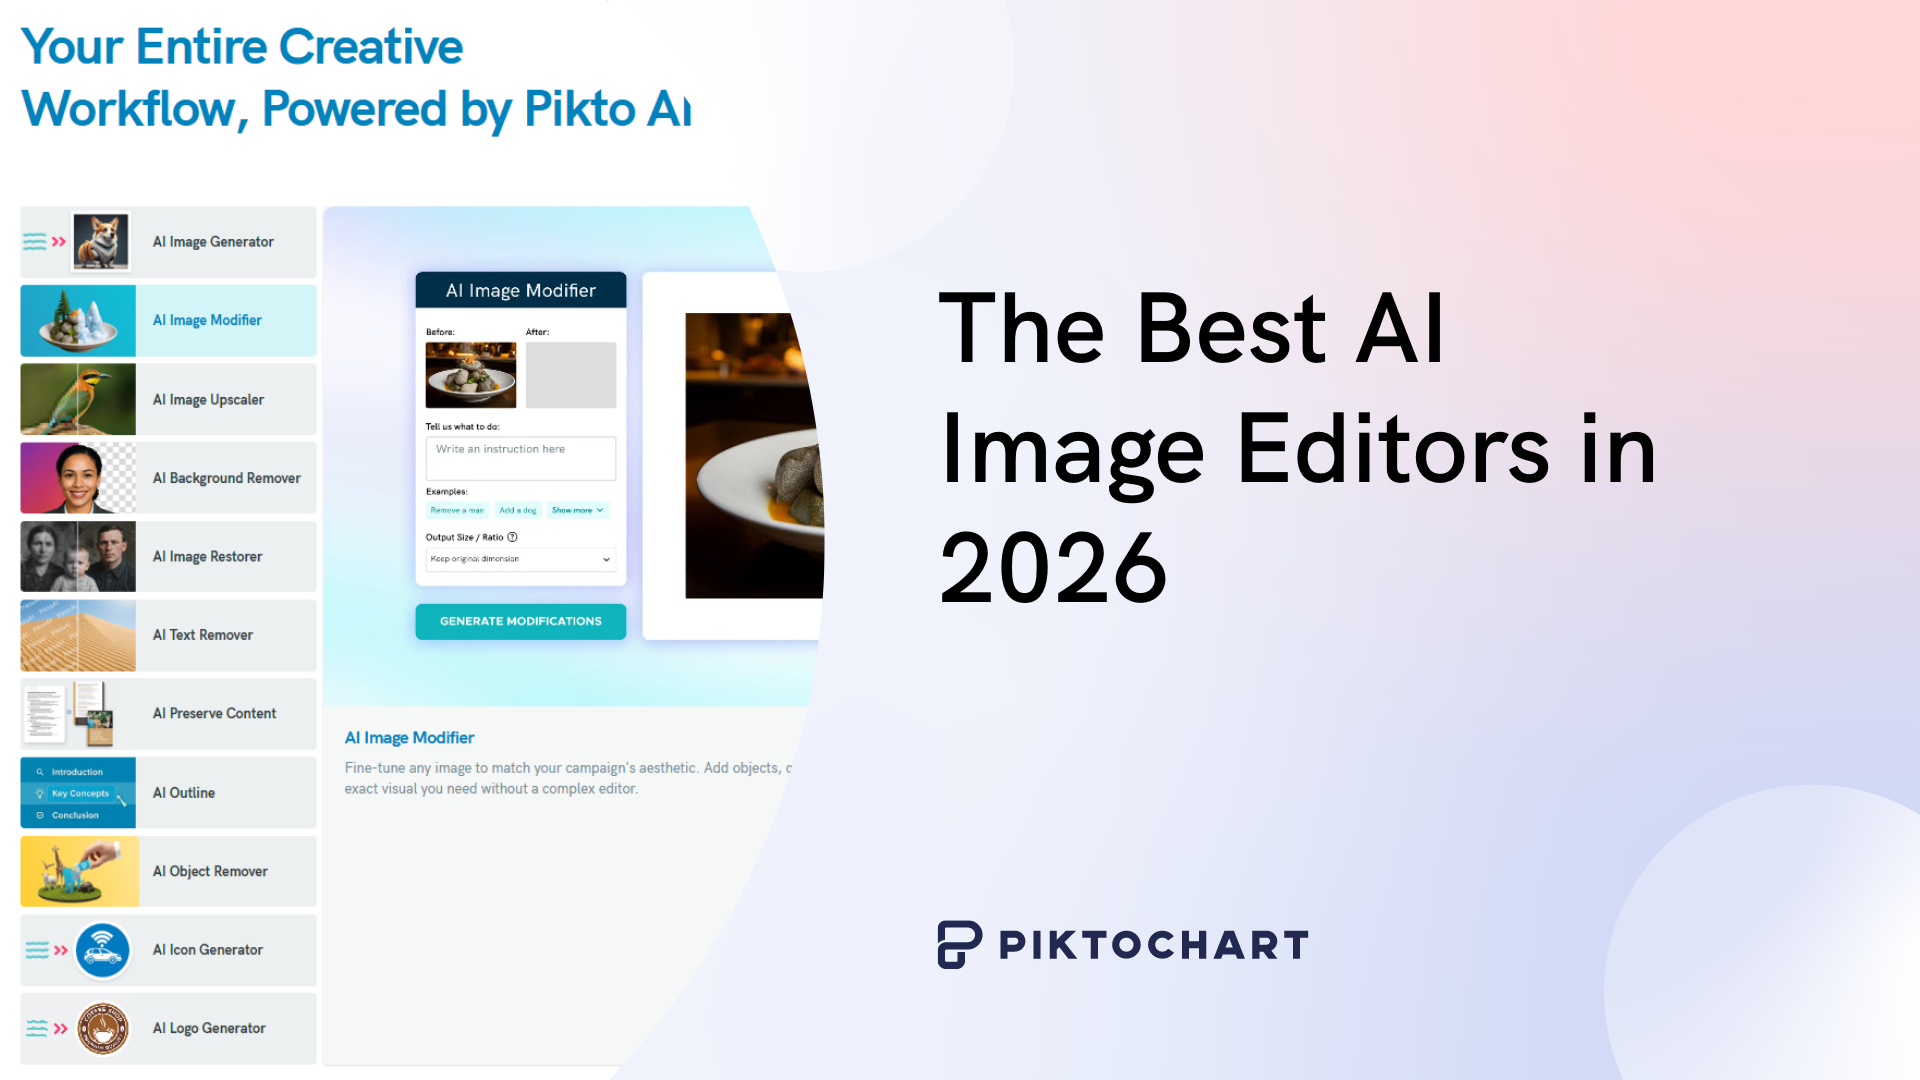
Pikto AI not only has a feature that lets you upgrade your existing reports visually (and automatically), it can even create reports for you from scratch that you can quickly and easily fine-tune.
While both Pikto AI and ChatGPT use AI to generate reports, the differences between what they produce showcase why it’s important to use dedicated design tools.
All show but no substance
What ChatGPT can do
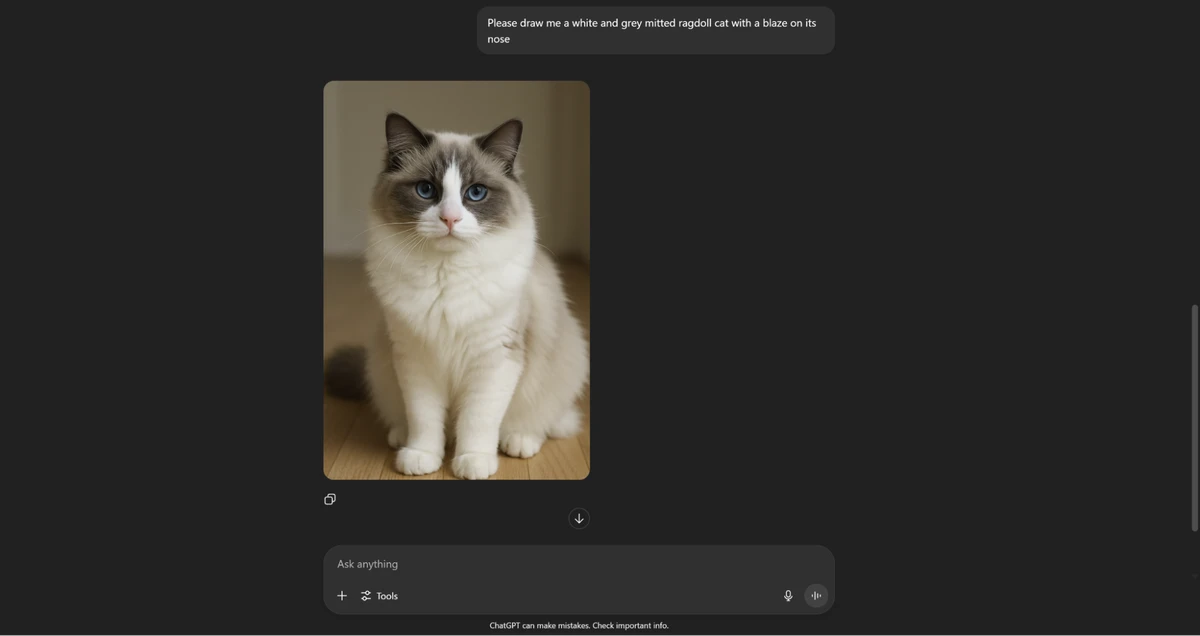
Although ChatGPT is usually more associated with writing than it is with generating images (Ghibli style art aside), ChatGPT can also “reproduce” images.
This means that ChatGPT will do its best guess of what an image should look like and try its best to recreate it, but the results themselves aren’t actually a reproduced image.
For example, I asked ChatGPT to draw me a ragdoll cat, and here is the result:
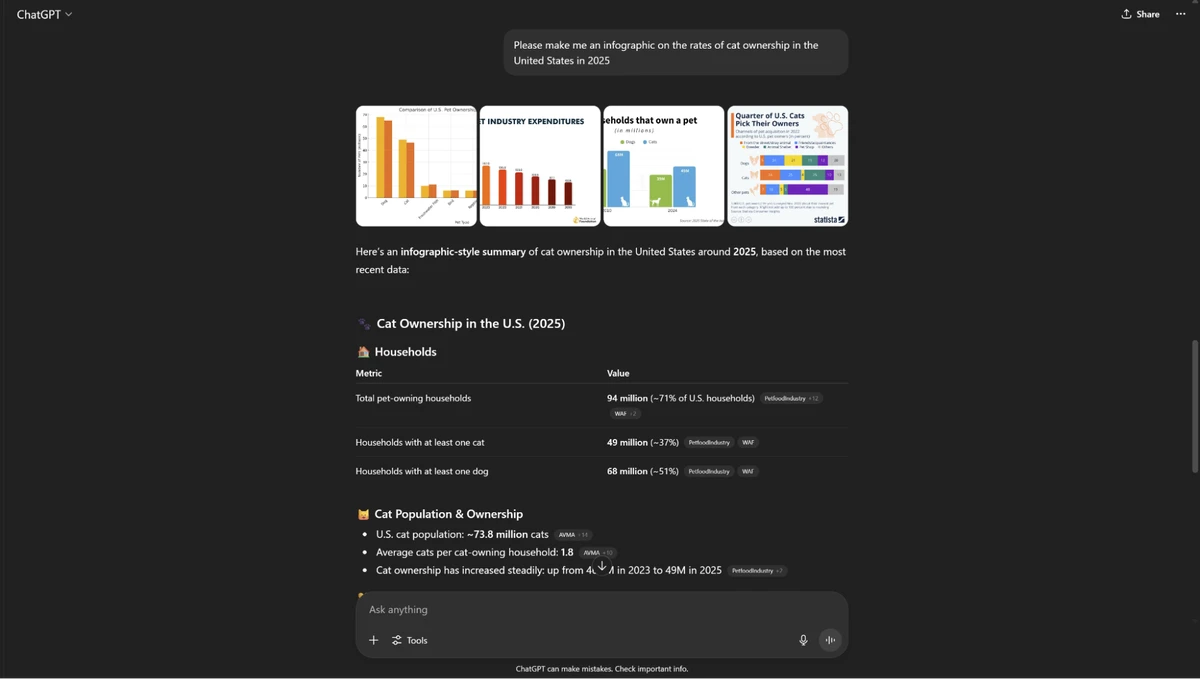
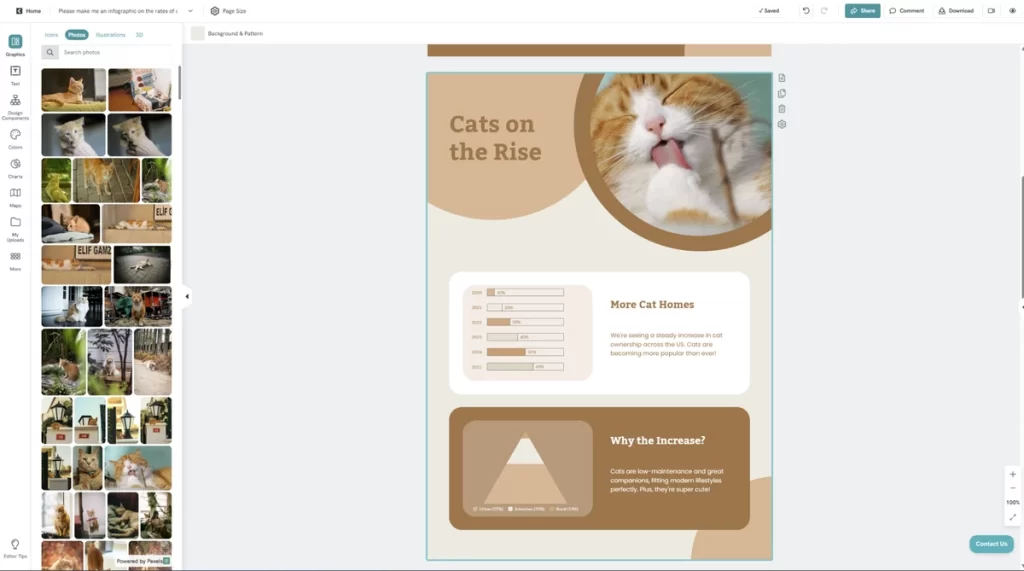
Additionally, if you ask ChatGPT to make you an infographic, it will do its best to create one for you, even if it’s not always the most aesthetically pleasing graphs.
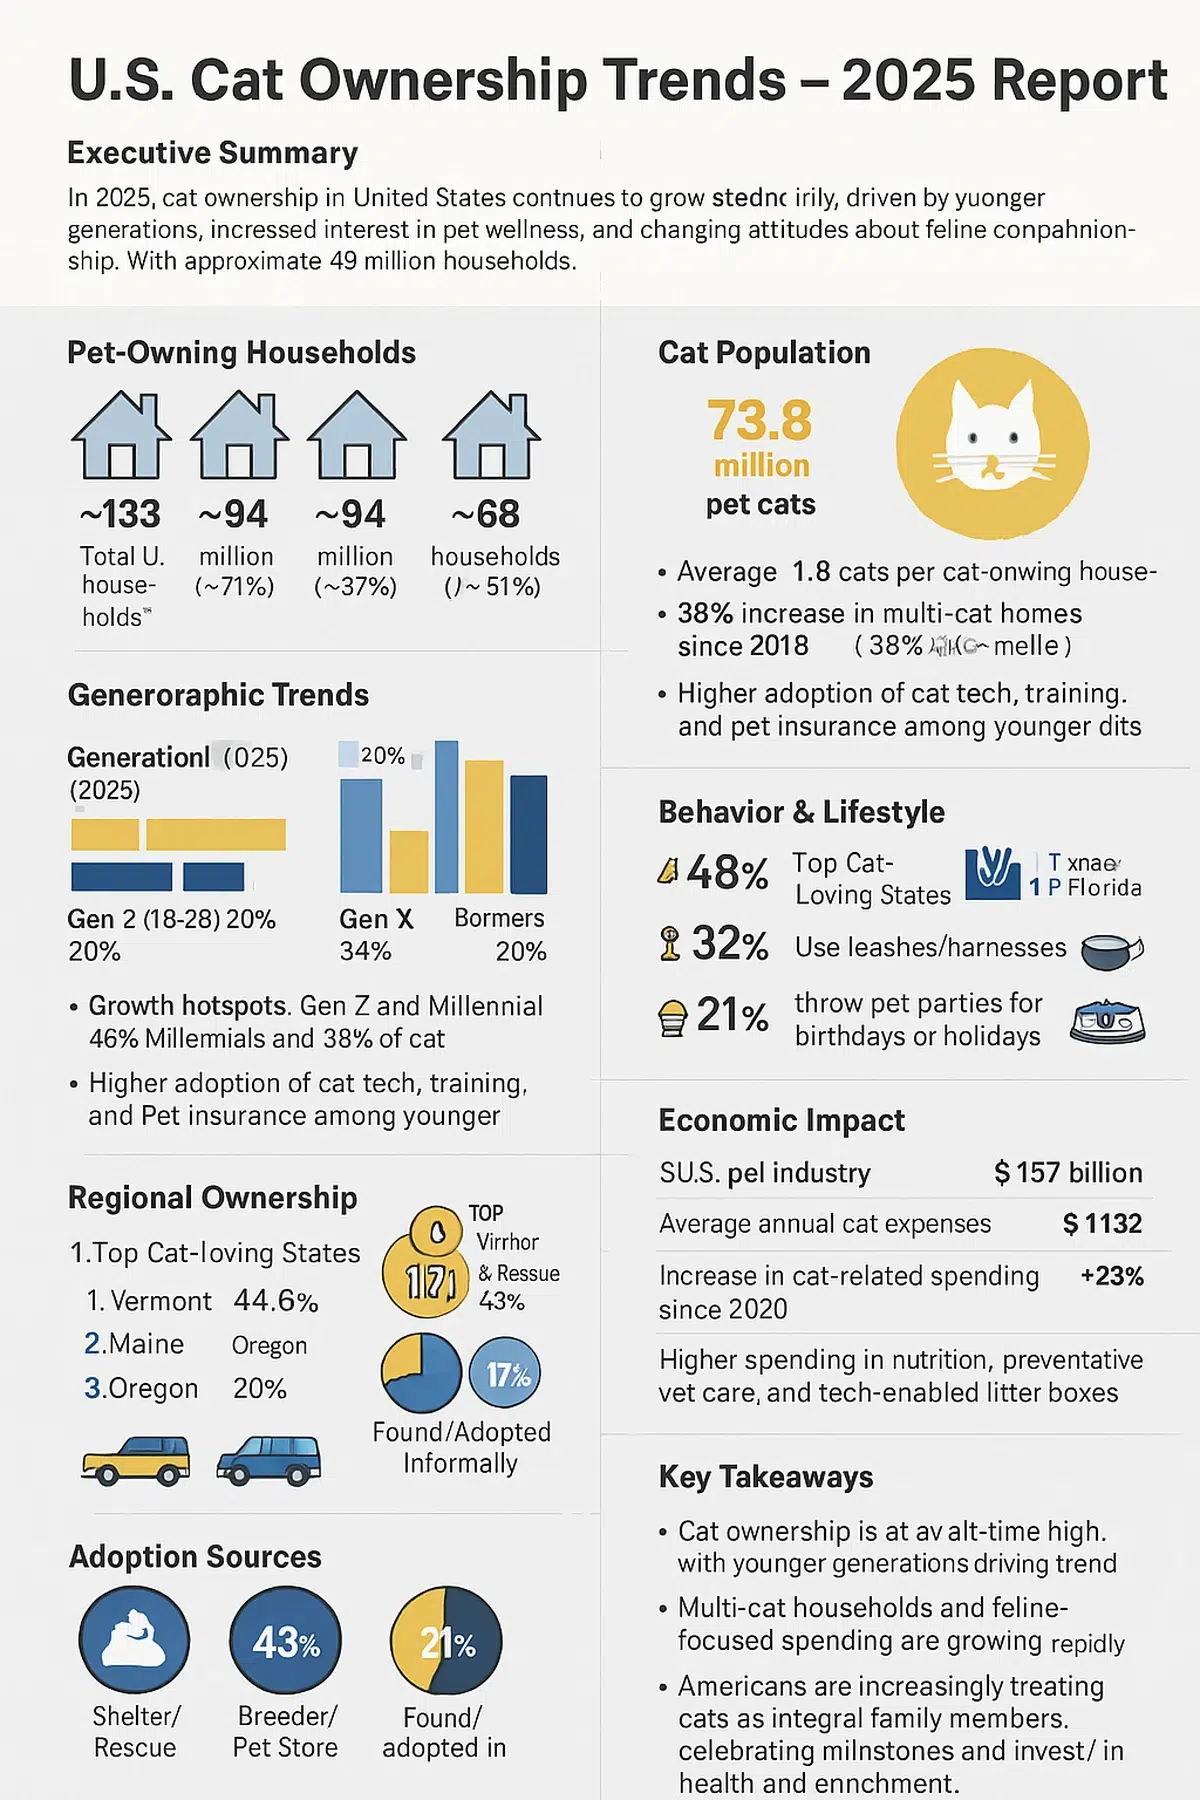
Below, I asked ChatGPT to make me an infographic about the rates of cat ownership in the United States in 2025:
What ChatGPT can’t do
The OpenAI LLM tool understood the assignment enough to produce an appropriate infographic. Unfortunately, ChatGPT doesn’t allow you to edit the images, infographics, or reports that it generates. This means that if you notice an error in the data, you can’t edit it.
Nor can you change the colors used in your infographics and reports that ChatGPT creates. This means that if you have specific brand or company colors that you want in the graphs or reports, you’re out of luck.
You’re also unable to store brand assets in the cloud, which means that if you need specific colors or logos, you can’t just insert them into your ChatGPT visual.
Finally, ChatGPT doesn’t allow you to save templates to re-use again and again. Even if ChatGPT designs the perfect report for you, you won’t be able to save it as a template for future reports.
Instead, you’ll have to try to remember the exact phrases you used and hope that ChatGPT can recreate it for you again.
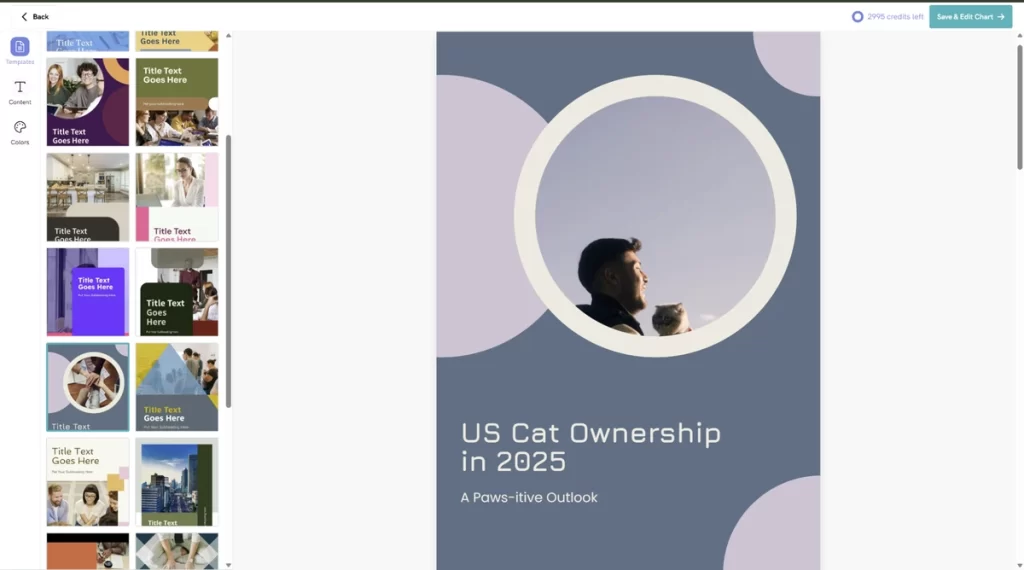
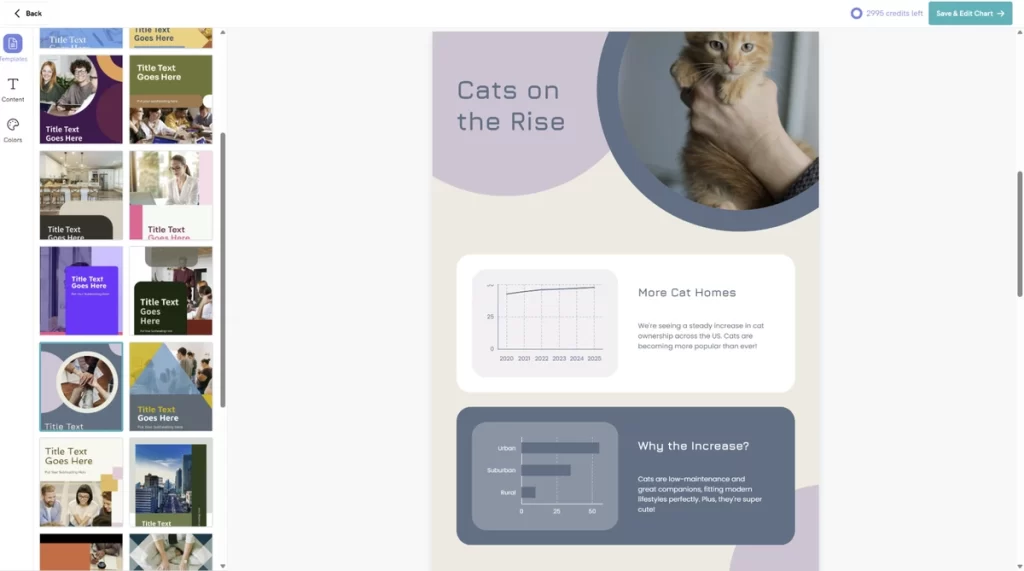
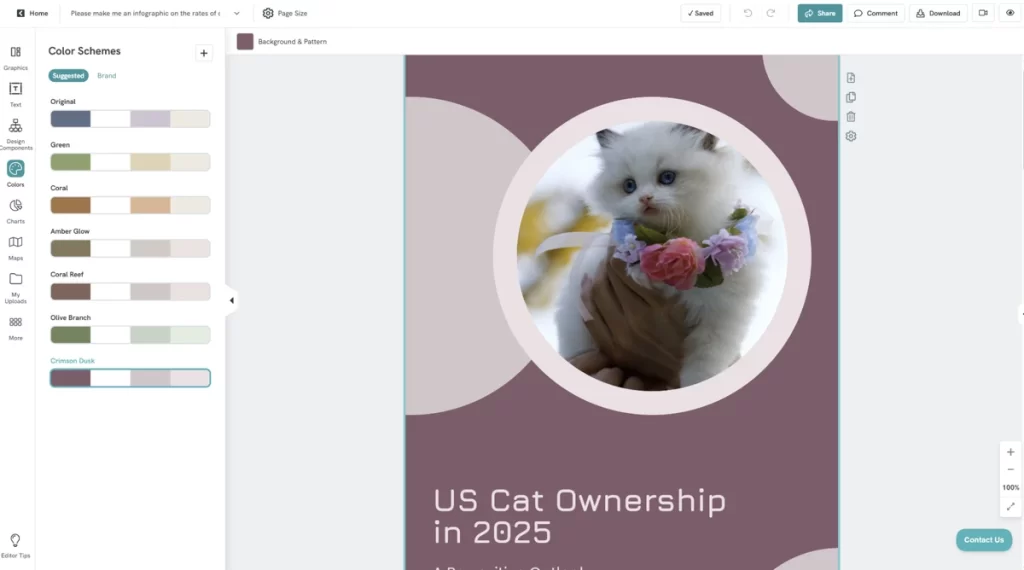
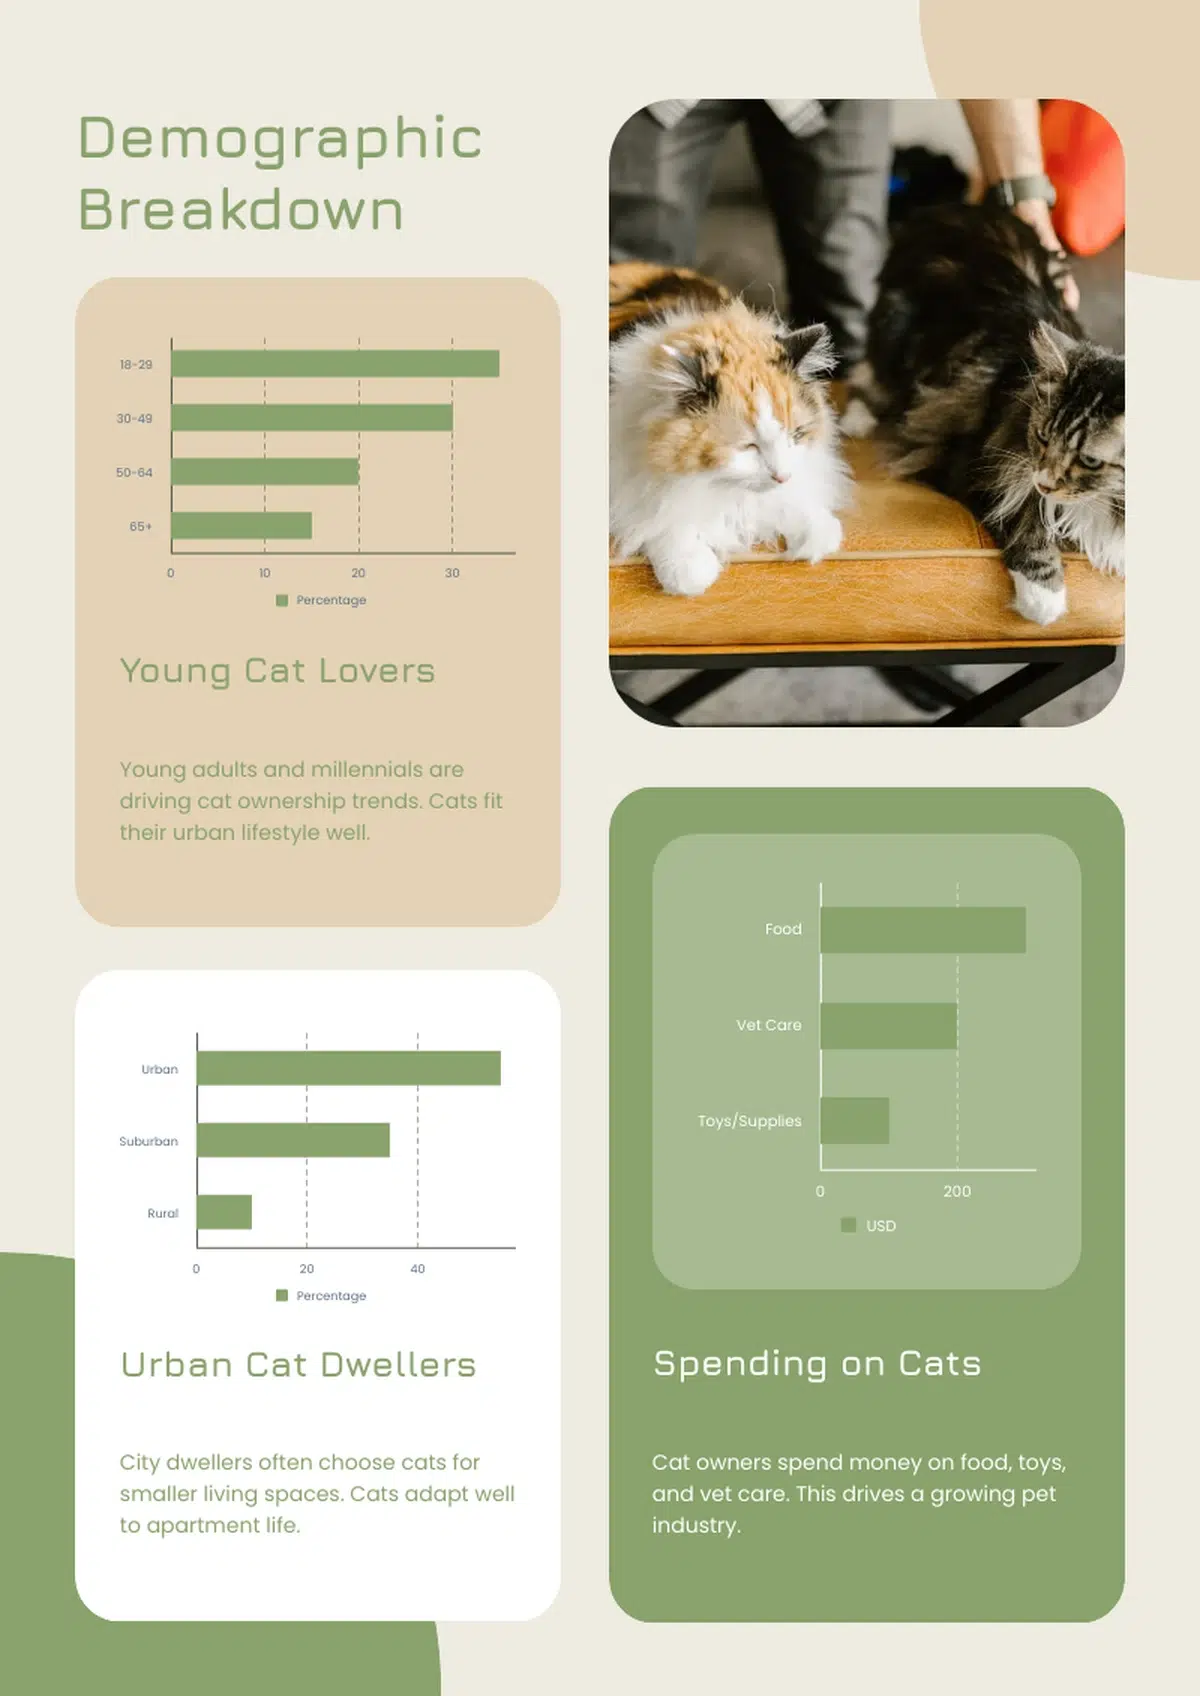
What Piktochart can do
Tools like Canva and Piktochart help you make perfect reports every time by allowing you to save templates and brand assets.
With Piktochart, you can easily change the colors, images, text, and icons for every page of your report. You can insert custom images or ask Pikto AI to generate images for you that you can drag and drop into your report.
If you’ve landed on the perfect look, you can save your report as a template and use it as a framework for future reports.
That way, all you have to do in the future is insert different text and images for your report and you’re good to go, no need to reinvent the wheel again.
Before:
After:
The age of AI means multi-tier subscriptions
Just like how Netflix may not have the show you want to watch so you subscribe to Hulu, the same goes for AI tools.
If you want to put your best foot forward professionally, you may want to subscribe to more than one AI tool.
In my opinion, if I can get “better” writing from ChatGPT and great design from Pikto AI, it’s worth it to pay for two services rather than get only decent results from one.
Even though ChatGPT can create reports, Pikto AI’s final product is more impressive.
If I need consistent designs, it makes sense to use Pikto AI, where I save time with templates that keep my brand’s look consistent.
Pikto AI and Canva both provide design services that ChatGPT can’t, but Pikto AI allows you to get information to stakeholders more easily than Canva or ChatGPT.
So, why not try Pikto AI today?