How many people use social media in 2026? More than 5.24 billion, according to the latest data. To put it another way: nearly 64 out of every 100 people on the planet now have an active social media account.
The global user count has grown by more than 5x since 2010, when roughly 970 million people were on social platforms. Growth continues to accelerate in emerging markets across Asia, Africa, and Latin America, while mature markets see gains in time spent per session and multi-platform adoption (the average user now juggles 6.83 different platforms).
Below, we break down social media usage by country, region, age, gender, and platform. We cover how long people spend scrolling each day, why they log on in the first place, and which platforms attract the largest audiences worldwide.
Social media user growth over time
Social media adoption has surged over the past 15 years, transforming from a fringe activity into near-universal global behavior.
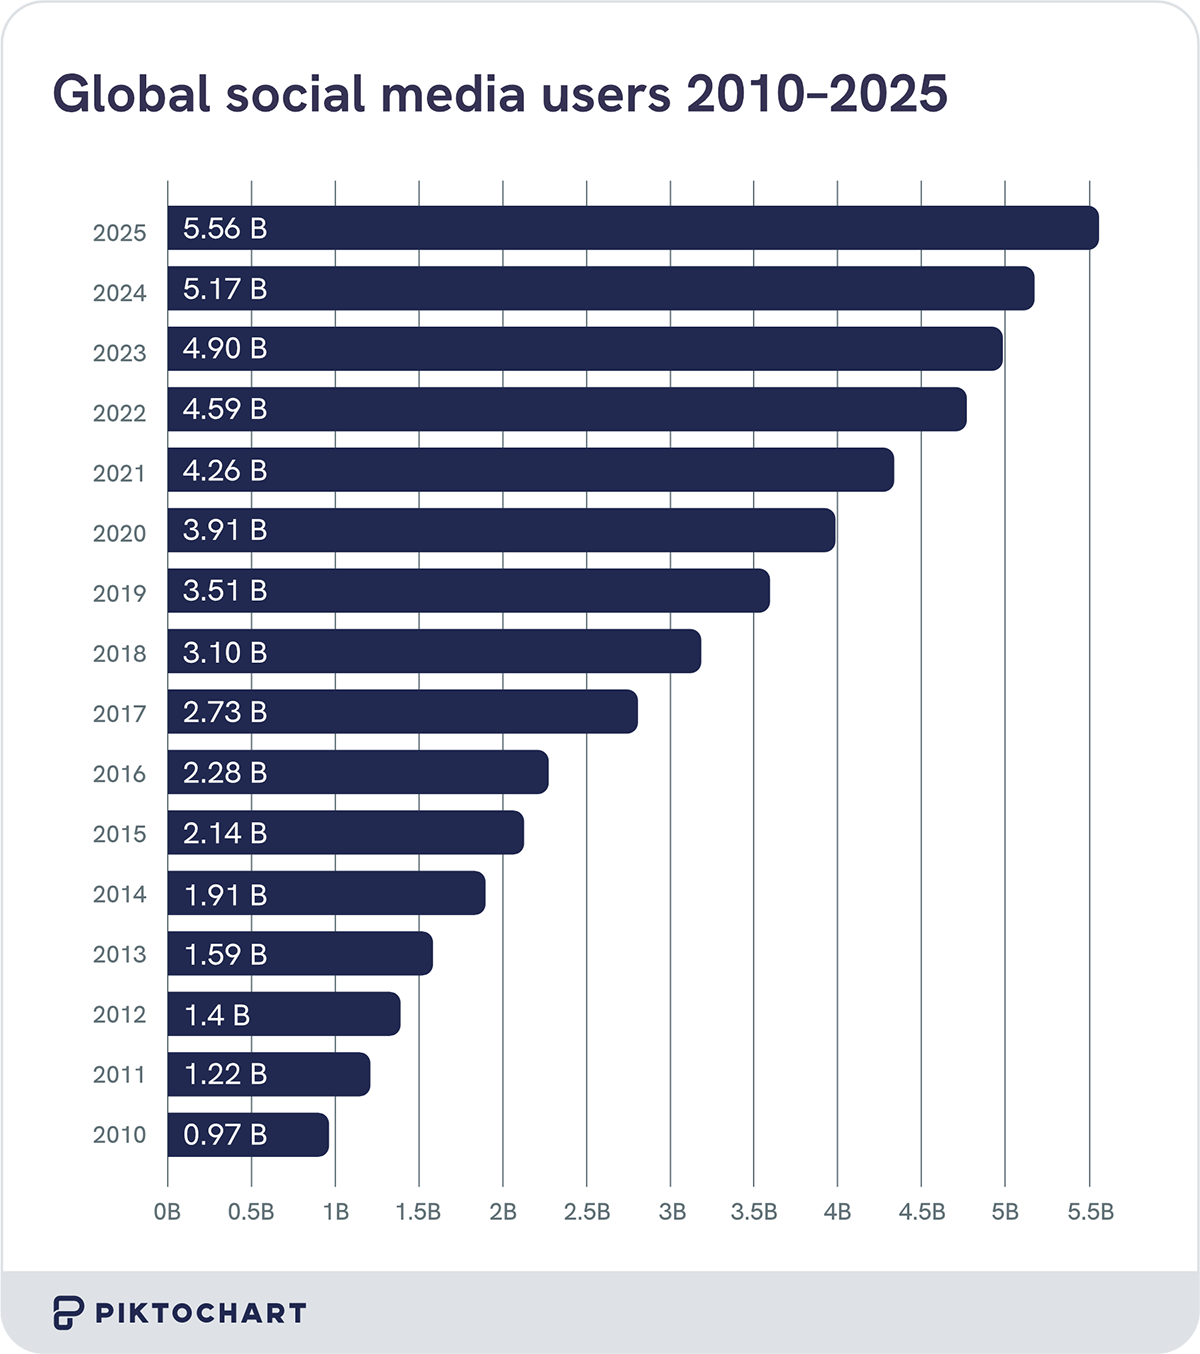
Growth in number of users
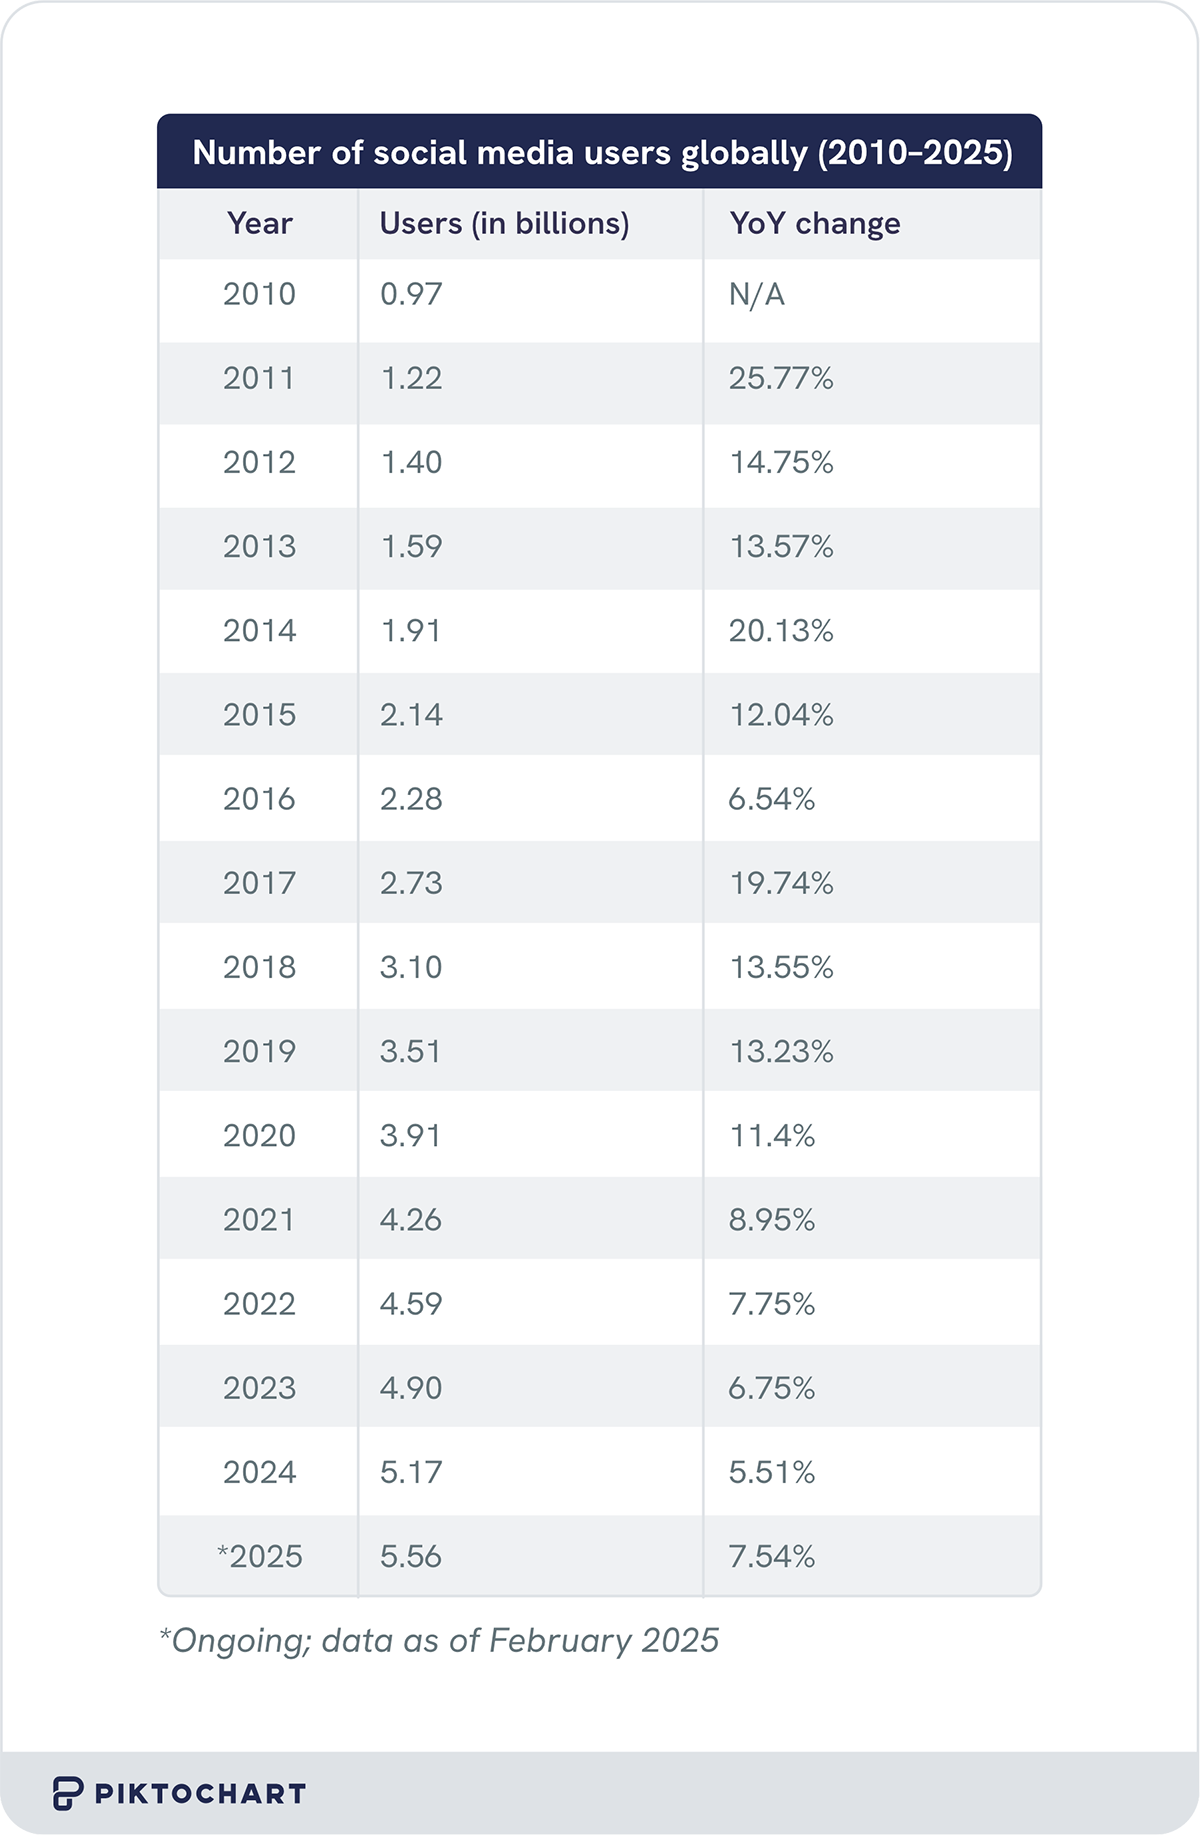
In terms of users, social media has evolved from under a billion in the early 2010s to billions today across multiple major platforms.
- In 2010, fewer than 1 billion (970 million) people were using social media users.
- By 2014, this number had nearly doubled to 1.91 billion, and by 2017, it had reached 2.48 billion.
- In 2024, global usage climbed to 5.17 billion users.
- Today, as of early 2025, the figure stands at 5.42 billion, meaning about two-thirds of the world’s population now uses social media.
- This reflects a compound annual growth rate (CAGR) of approximately 12.6% from 2010 to 2025 and this growth is on track to exceed original projections of reaching over 6 billion by 2028.
- Currently, as of early 2025, Facebook accounts for 3.07 billion monthly active users, making it the largest social network. It is followed by YouTube with 2.53 billion and Instagram with 2 billion.
Growth in time spent on social media
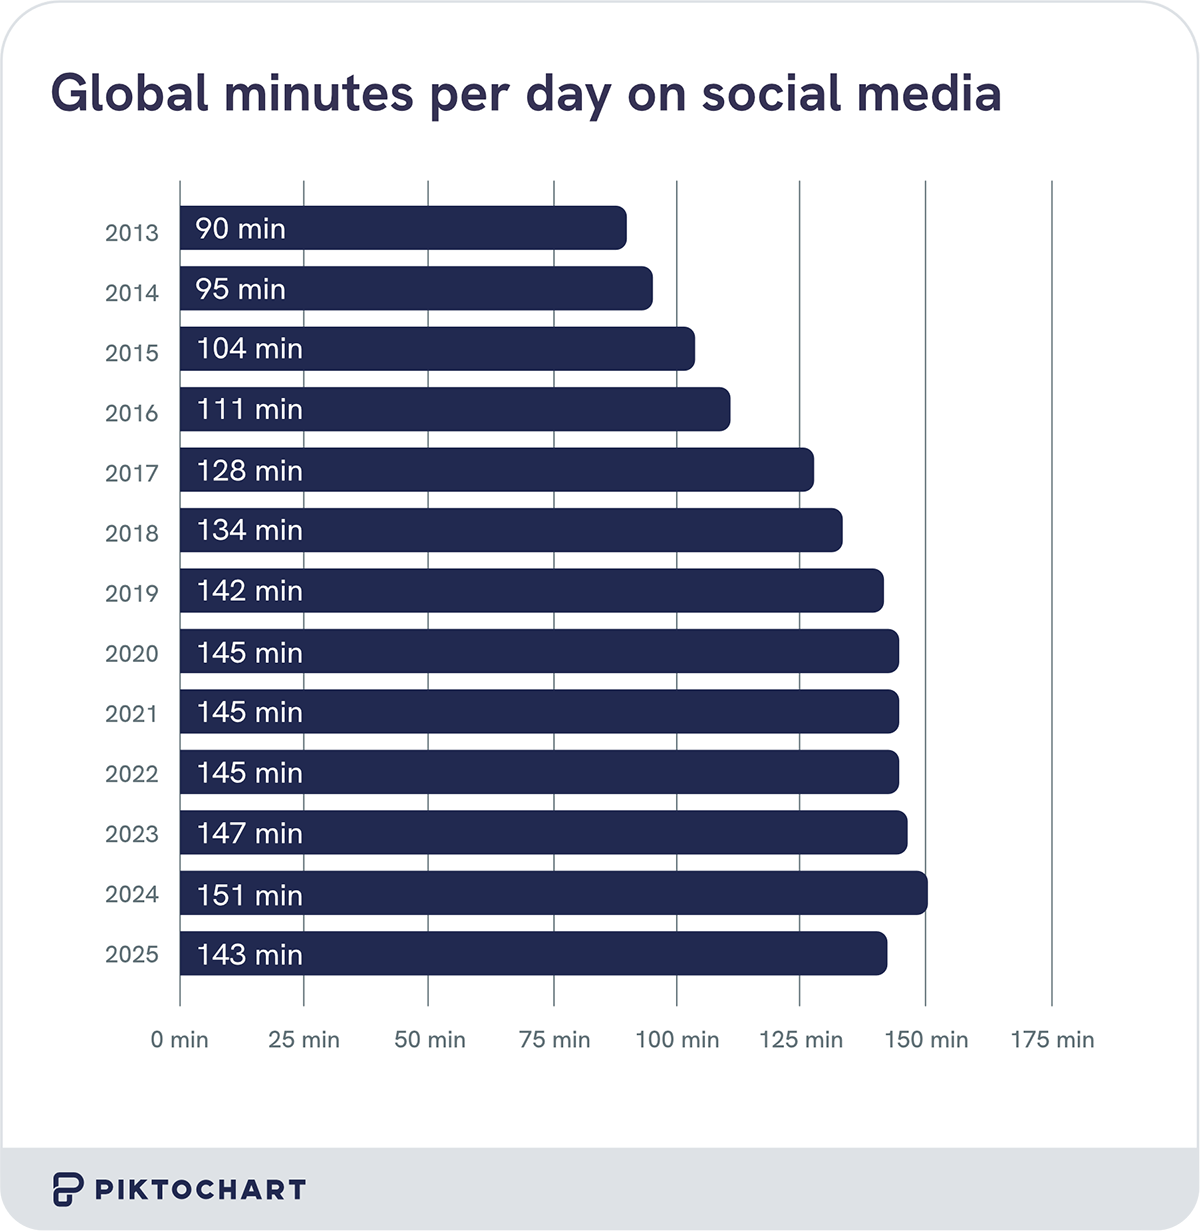
Global time spent on social media has steadily increased over the past decade, reflecting deeper daily integration into users’ lives.
- In 2012, the average internet user spent 90 minutes per day on social media.
- In 2018, users were spending over two hours (142 minutes) daily, rising to 145 minutes in 2019, a level that held through 2021.
- Time spent on social media peaked in 2023, at two and a half hours (151 minutes) per day.
- As of 2024, users spent an average of 143 minutes per day, a slight decrease from the previous year.
Social media users by country
Social media usage varies widely across countries, influenced by factors like population size, internet access, platform preferences, and cultural habits.
United States
As of January 2025, 253 million people were using social media in the US, representing about 73% of the total population.

By age
- According to 2021 data, 84% of US adults between the ages of 18 and 29 reported using social media.
- 81% of US adults aged 30–49 used social media, compared to 73% of those aged 50–64 and 45% of those 65 and older.
By gender
- In the US, social media usage is nearly evenly split by gender; women account for 50.2% of users and men for 49.8%.
By platform and usage behavior
- 83% of American adults use YouTube, followed by 68% who use Facebook and 47% who use Instagram.
- Americans use an average of 6.48 different social media platforms.
- As of 2023, Americans spend about 2 hours and 18 minutes on social media each day.
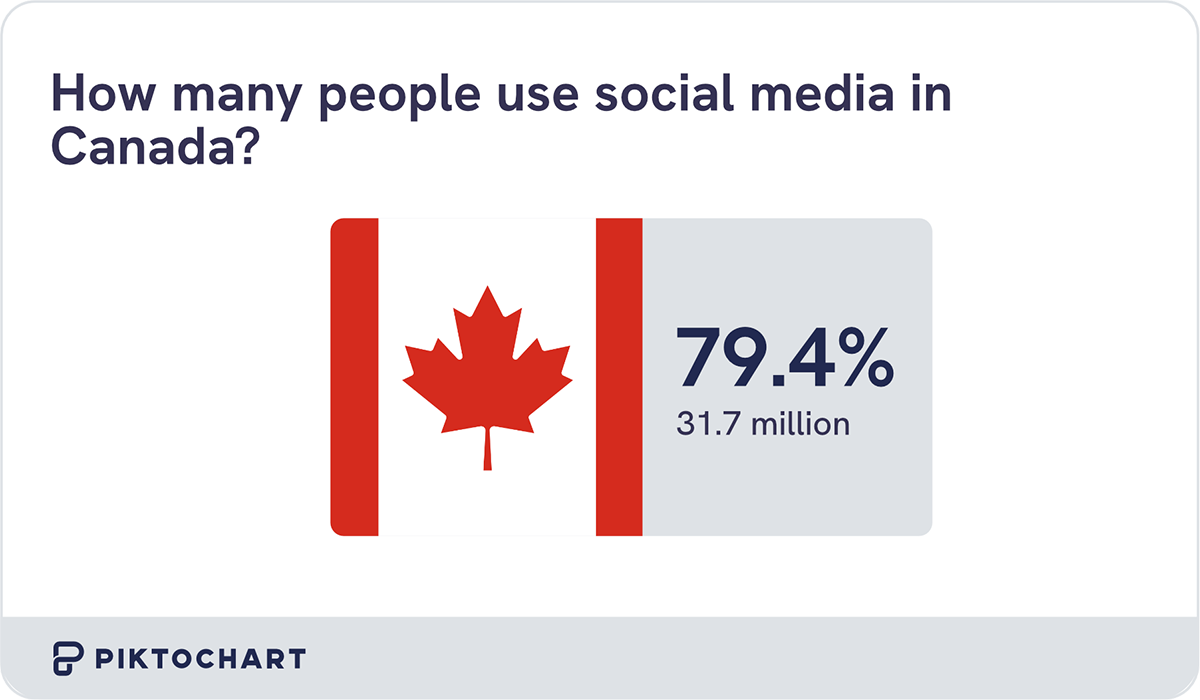
Canada
Canada has about 31.7 million user identities, representing about 79.4% of the country’s population.
- The number of social media users in Canada grew from 26 million in 2020 to 31.34 million in 2023. It is projected to grow to 36.79 million by 2029, reflecting a CAGR of 7%.
By age
- According to 2021 data, adults aged 25–34 made up the largest share of social media users in Canada at 25.7%, followed by those aged 35–44 at 19.2% and 45–54 at 14.6%.
- As of January 2025, 83.4% of all internet users in Canada, across all age groups, were active on at least one social media platform.
By gender
- Social media usage in Canada is nearly evenly split by gender; women account for 50.2% of users and men for 49.8%, the same as that of the US.
By platform and usage behavior
- According to ad data, YouTube is the most-used platform in Canada with 31.7 million users, followed by Facebook (23.9 million) and Instagram (19.8 million).
- In 2023, Canadians spent about 1 hour and 53 minutes on social media every day.
| Social media platform usage in Canada | ||
|---|---|---|
| Platform | Users (in millions) | Penetration (%) |
| 23.9 | 59.8 | |
| 19.8 | 49.6 | |
| 27 | 67.6 | |
| Snapchat | 12.8 | 32 |
| X (formerly Twitter) | 10.7 | 26.7 |
United Kingdom
The UK has about 54.8 million active social media users, making up 79% of the total population.

By age
- Adults aged 30–49 make up the largest share of social media users in the UK, accounting for 46% of the total. They are followed by those aged 50–64 at 31%, while users aged 18–29 represent the smallest segment at just 24%.
By gender
- As in the US and Canada, the gender distribution of social media users in the UK is nearly even, with 49.9% identifying as female and 50.1% as male.
By platform and usage behavior
- WhatsApp was the most widely used social media platform in the UK in 2024, with 79.9% of internet users. It was followed by Facebook (72.3%), Facebook Messenger (56.6%), and Instagram (54.1%).
- According to 2024 data, Britons spend about 1 hour and 37 minutes on social media every day.
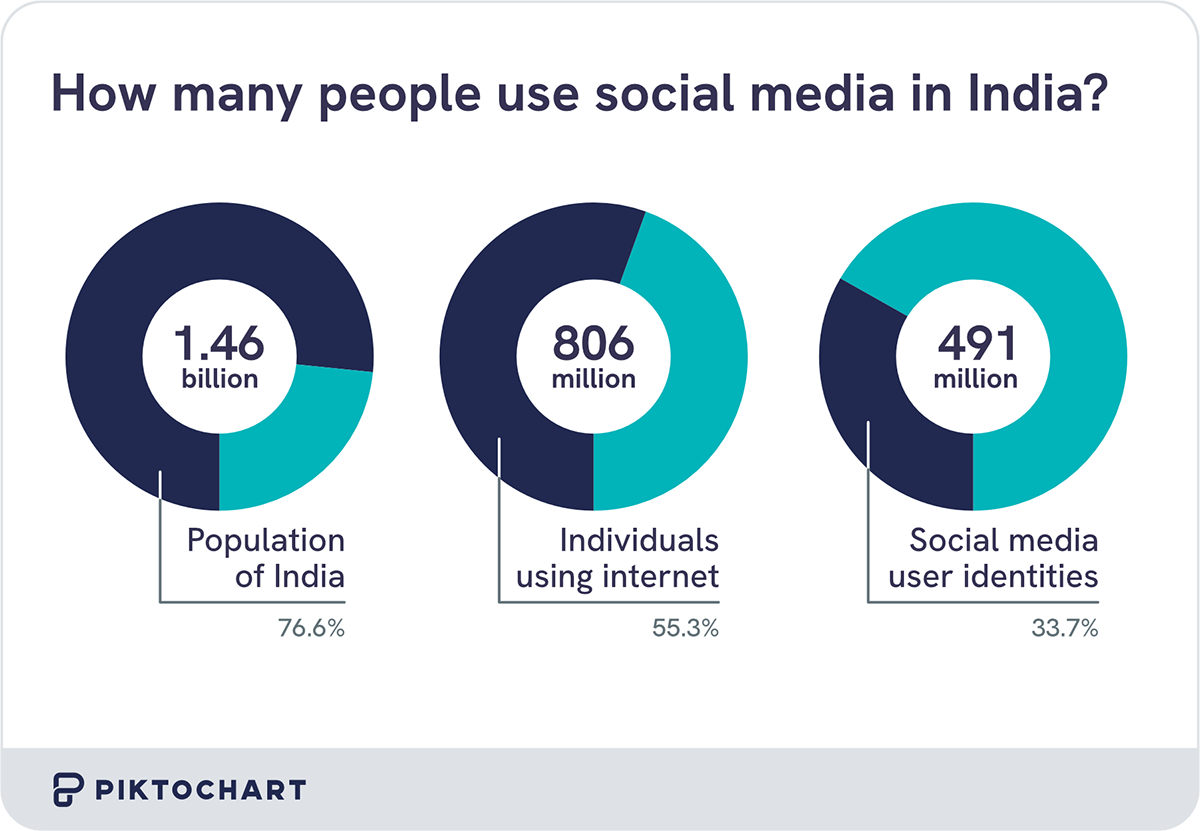
India
As of January 2025, India has approximately 491 million social media user identities, accounting for 33.7% of the country’s total population. This marks a year-over-year increase of 29 million users, or 6.3%, compared to January 2024.
By age
- According to 2022 data, 18–25-year-olds made up the largest social media user group in India, and 31% of them actively use between six and nine platforms simultaneously.
- As of January 2025, 60.9% of internet users in India, across age groups, were active on at least one social media platform.
By gender
- Social media user identities in India are heavily skewed toward men; 65.5% of adult users identify as male and only 34.5% as female.
By platform and usage behavior
- WhatsApp ranks as the leading social media platform in India, used monthly by 80.8% of internet users, followed by Instagram at 77.9% and Facebook at 67.8%.
- According to data from 2023, Indians spend about 2 hours and 26 minutes on social media every day.
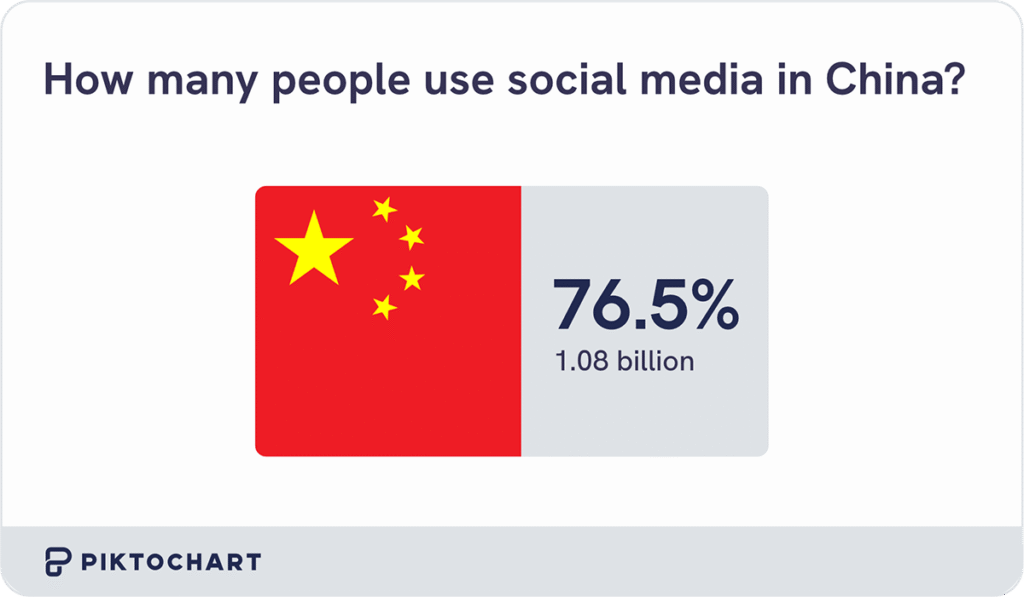
China
China has about 1.08 billion user identities, representing about 76.5% of the country’s population.
- As of January 2025, nearly all internet users in China (98%) were active on at least one social media platform.
- As of Q3 2024, WeChat was the most-used social media platform in China, with a monthly usage rate of 91.8% among internet users, followed by Douyin (83%), QQ (63.4%), and Baidu Tieba (60.2%).
- According to data from 2023, Chinese internet users spend about 1 hour and 56 minutes on social media every day.
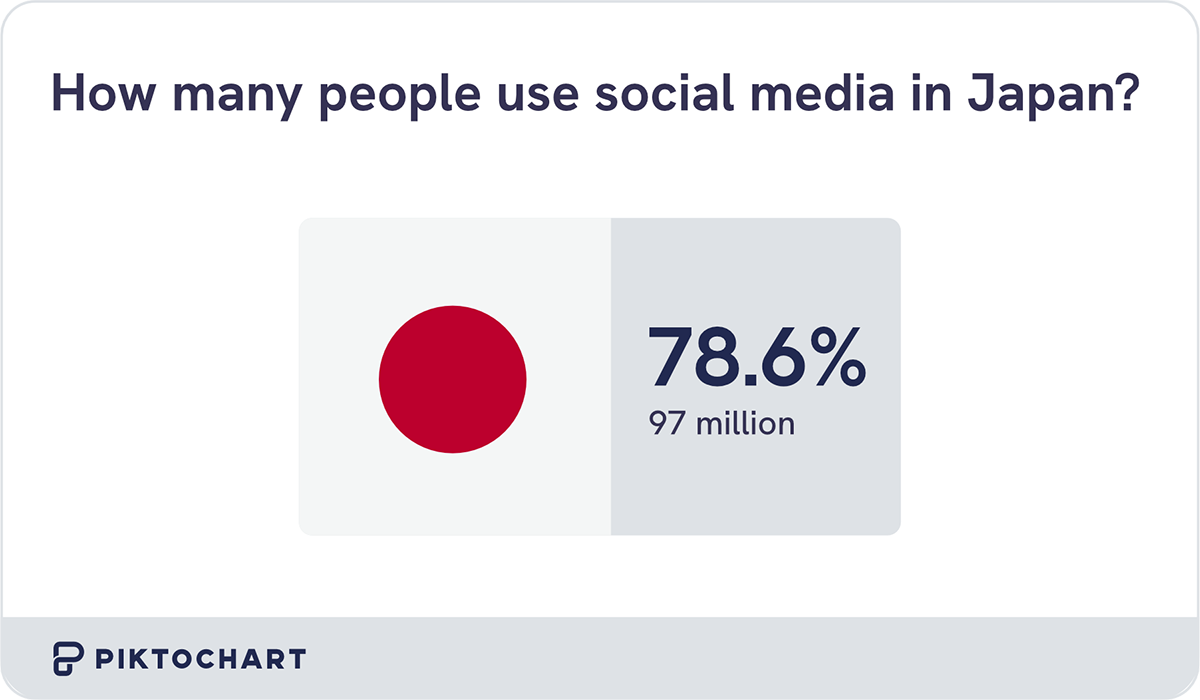
Japan
As of early 2025, Japan had approximately 97 million active social media user identities, representing 78.6% of the total population.
- In 2023, 93% of Japanese internet users in their 20s used social media, while 90% of teenagers were also active on these platforms.
- According to ad data, LINE is the most widely used social media platform in Japan, with 97 million users, followed by YouTube with 78.7 million, X (formerly Twitter) with 70.9 million, and Instagram with 57.5 million users.
- In 2023, Japanese users spent about 53 minutes on social media every day, the lowest of any country.
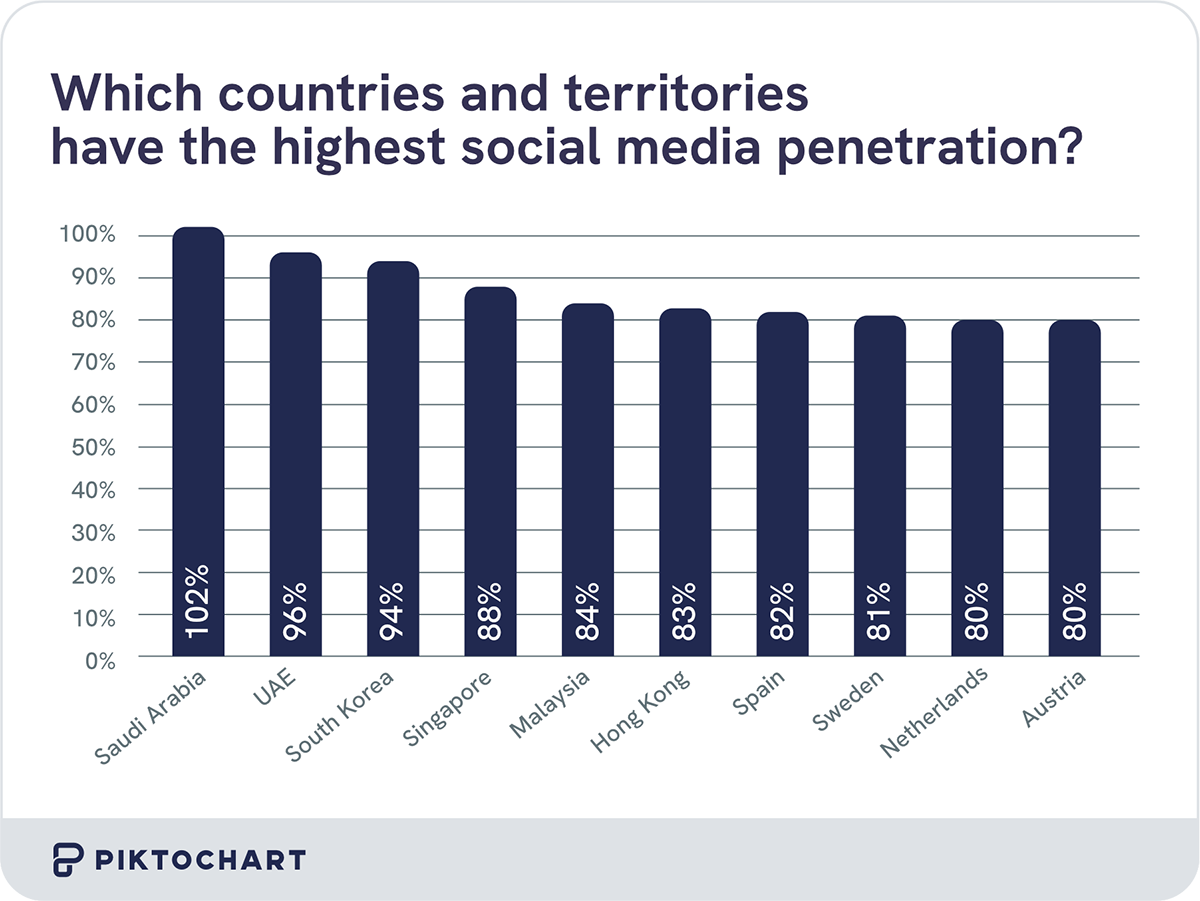
Other countries
- Saudi Arabia leads globally in social media penetration among surveyed regions, with active user identities equivalent to 102% of its population. The UAE and South Korea follow closely at 96% and 94%, respectively.
- In contrast, social media use remains low in parts of sub-Saharan Africa, where penetration rates fall below 26% in Kenya, Ghana, and Nigeria.
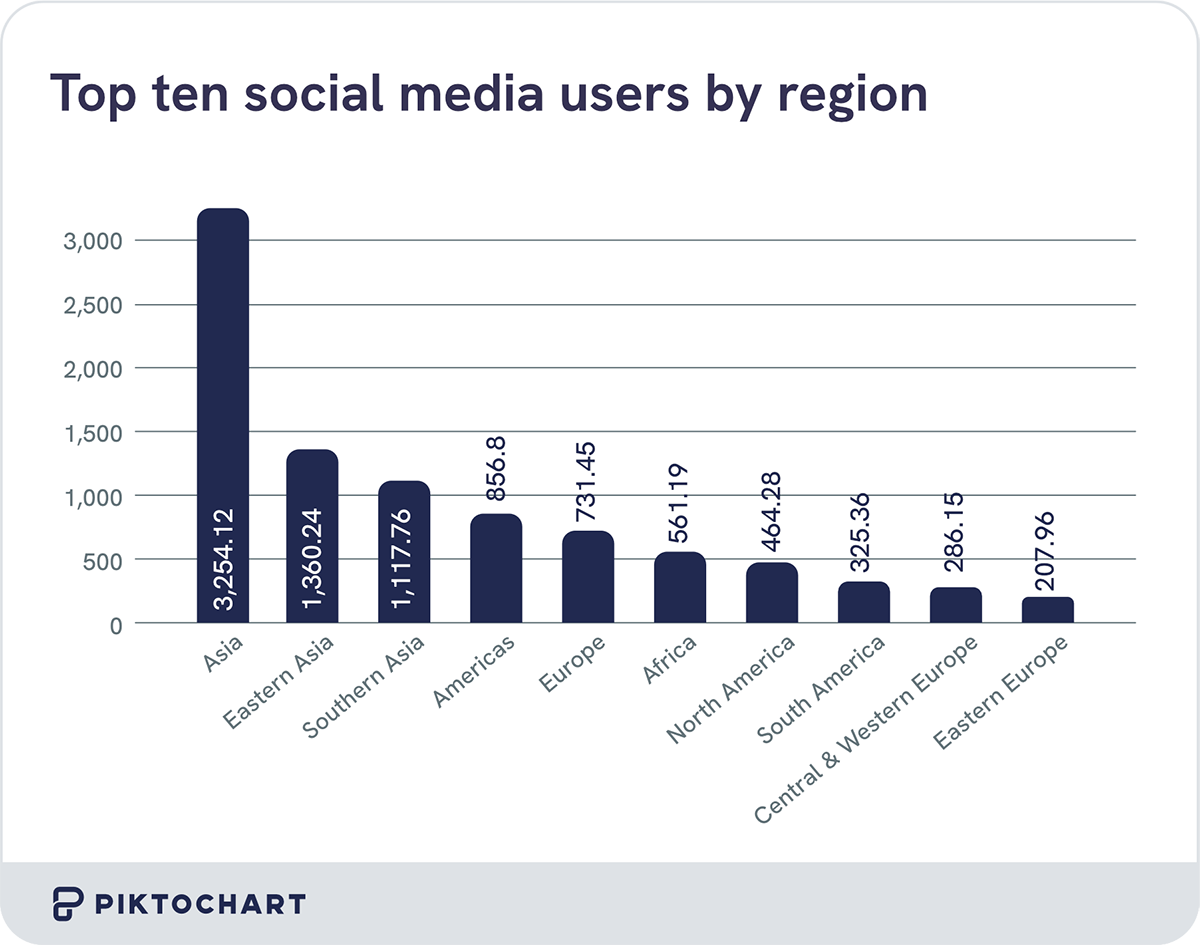
Social media users by region
Social media usage is concentrated in Asia, which far outpaces other regions in total user count.
- In terms of continents, Asia has the highest number of social media users at 3.25 billion users.
- Within Asia, East Asia accounts for 1.36 billion users, followed by South Asia with 1.12 billion.
- The Americas report 856.8 million social media users, while Europe has a combined total of 731.45 million.
How much time do people spend on social media?
People spend an average of 2.5 hours per day (2 hours and 23 minutes specifically) on social media around the globe.
- The average of 2.5 hours on social media comprises about one-third (35.8%) of the time people spend on the internet every day.
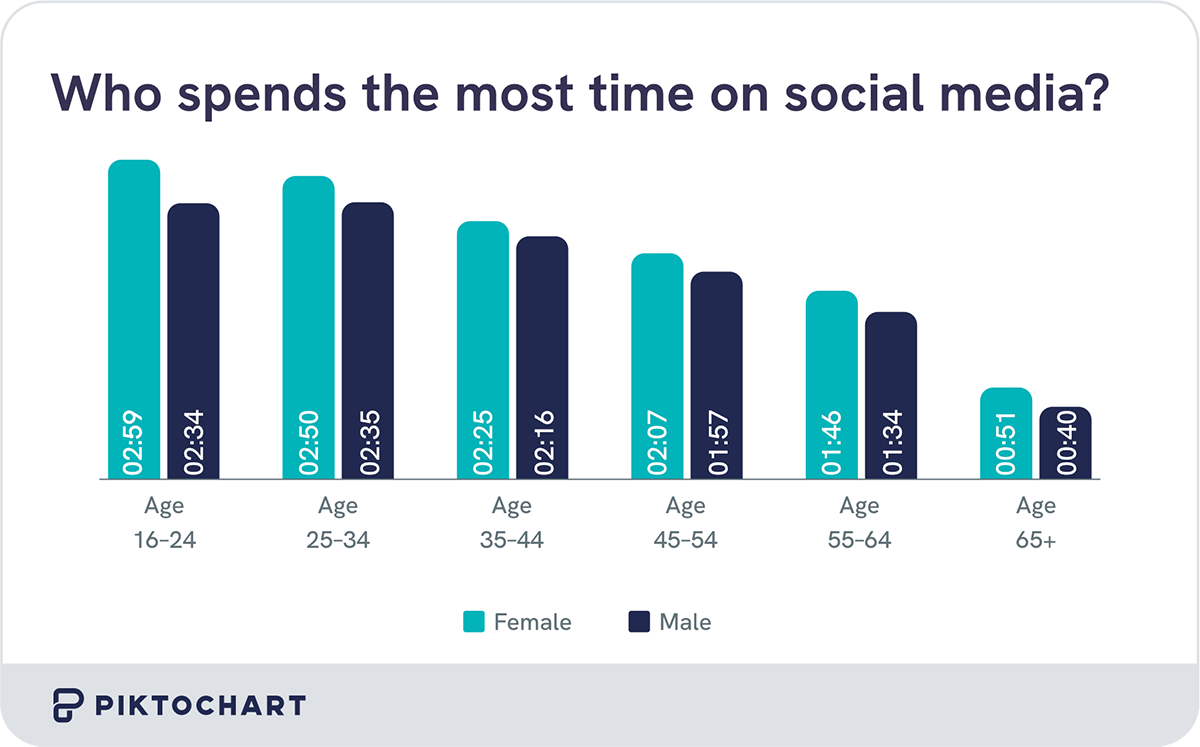
- Women ages 16–24 spend the most time on social media, averaging nearly 3 hours (2 hours and 59 minutes) per day, followed by women ages 25–34, at 2 hours and 50 minutes.
Time spent on social media by country
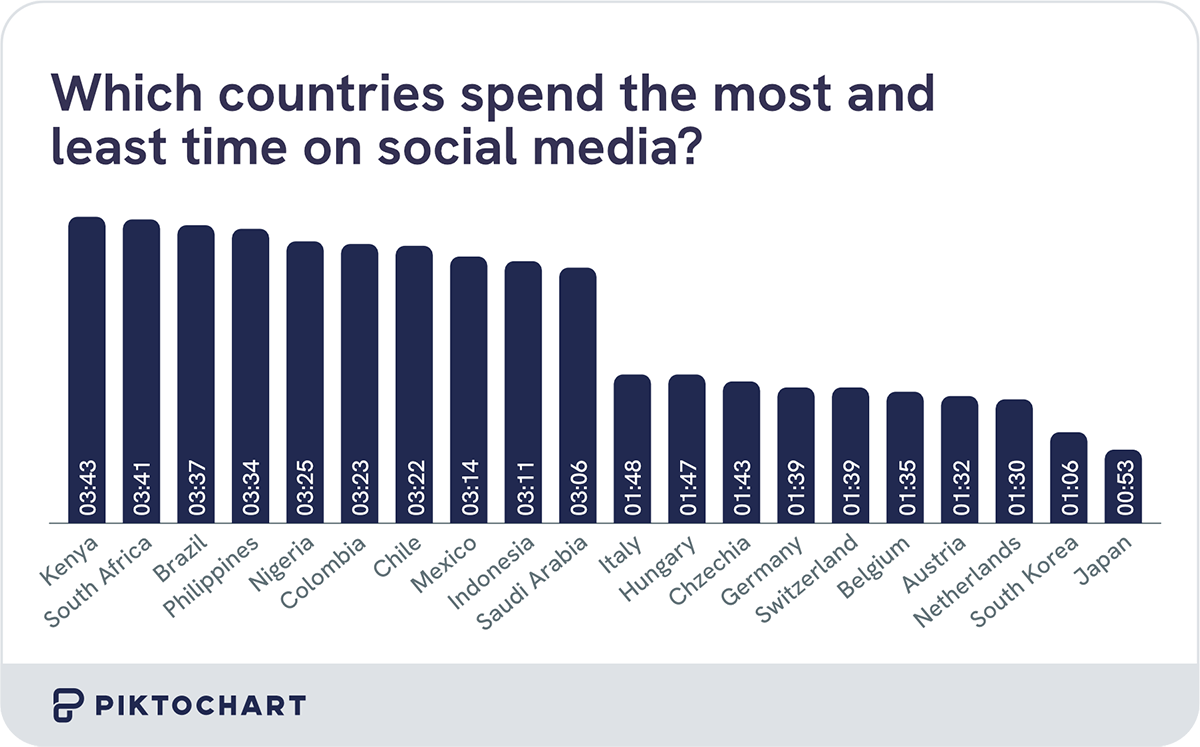
Kenya, Nigeria, the Philippines, and upper-tier emerging markets like South Africa rank highest in daily social media use, reflecting strong engagement in developing digital economies.
- Leading globally among surveyed countries is Kenya, where internet users spend an average of 3 hours and 43 minutes on social media daily.
- South Africa follows closely at 3 hours and 41 minutes, then Brazil at 3 hours and 37 minutes, and the Philippines at 3 hours and 34 minutes.
- Low-engagement countries include South Korea (1 hour and 6 minutes), the Netherlands (1 hour and 30 minutes), and Austria (1 hour and 32 minutes).
- Japan uses social media the least per day, at only 53 minutes on average.
Who uses social media the most?
The people who use social media the most tend to live in densely populated countries and belong to younger age groups. For more detailed research, read our report on social media demographics.
- China is home to the largest number of social media users globally, with 1.08 billion people actively using platforms as of early 2025.
- Women ages 16–24 are the most active demographic, spending nearly 3 hours per day on social media.
- Users aged 25–34 are the most consistently engaged generation in the US; 69.2% of them actively use social media in 2025.
- Saudi Arabia has the highest social media penetration globally, with usage surpassing 100% of the population due to multiple account ownership.
- Users in Kenya spend the most time (3 hours 43 minutes) on social media daily.
What do people use social media for?
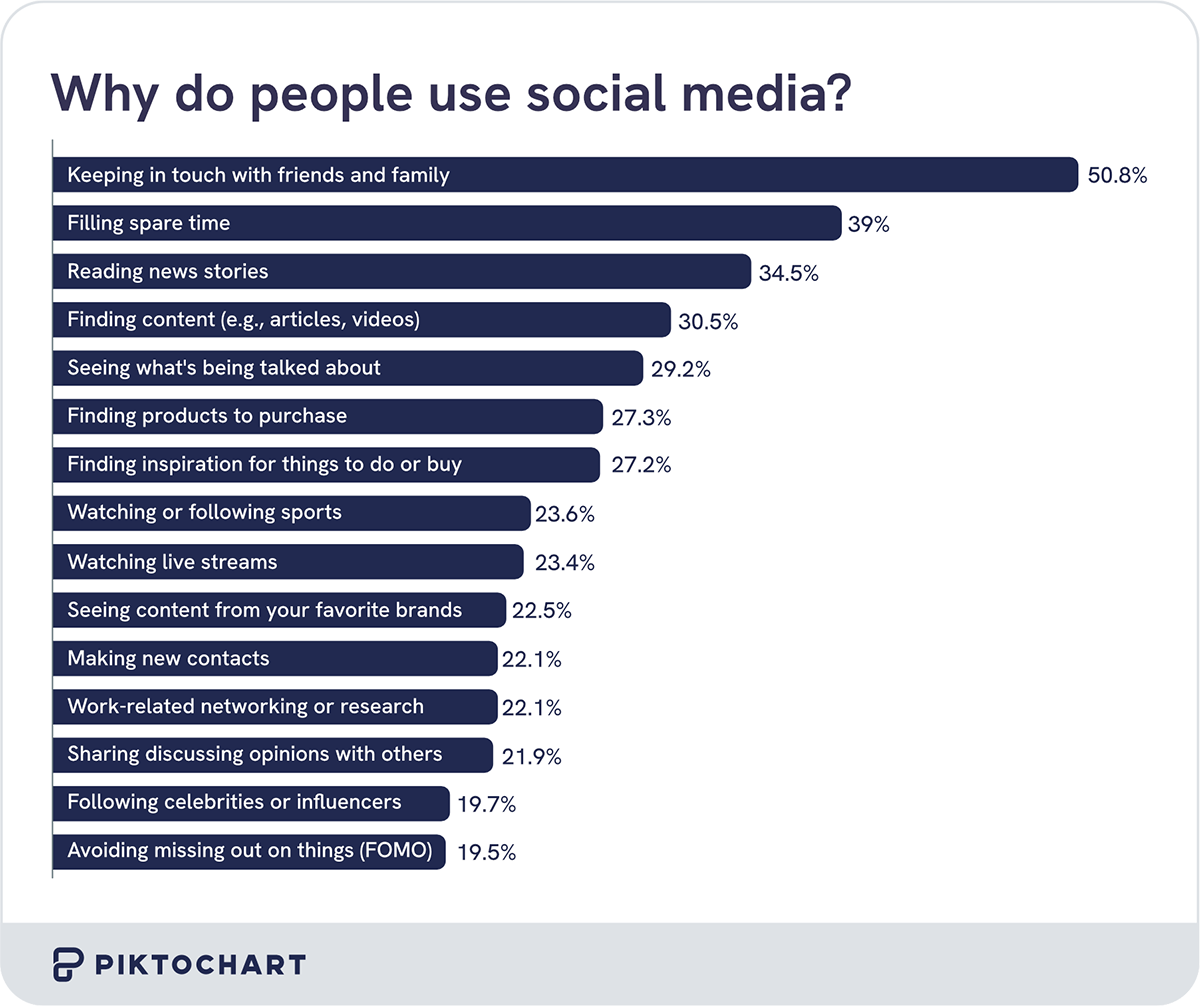
Social media continues to serve its core purpose: connection. But leisure-driven motivations like killing time or discovering entertaining content are nearly as influential.
- About half (50.8%) of global users say their primary reason for using social media is to stay connected with friends and family.
- 39% turn to social platforms to fill spare time, while reading news stories is a key driver for 34.5% of users.
- 30.5% use social media to discover content like articles and videos.
- Following influencers and celebrities (19.7%) and fear of missing out (FOMO) (19.5%) are the least common reasons people use social media.
Social Media for Business and Marketing
Social media is no longer a side channel for businesses. Roughly 37.6% of internet users worldwide now use social platforms for work-related activities, from brand building and customer engagement to lead generation.
The numbers behind this shift are significant. Global social media advertising spend is projected to reach $276.7 billion in 2026, reflecting steady annual increases as brands compete for attention in crowded feeds. In the United States alone, social commerce sales are on track to exceed $90 billion, with platforms like Instagram, TikTok, and Facebook adding native shopping features to shorten the path from discovery to purchase.
Influencer marketing has become a major budget line for brands of every size. US spending on influencer-driven campaigns is forecast to hit $6.24 billion, with micro-influencers (10,000 to 100,000 followers) delivering some of the highest engagement rates across categories.
For marketers and communications professionals, these trends underscore a practical reality: social media is where audiences spend their time, and meeting them there requires consistent, visually strong content. Tools like social media infographic templates can help teams produce on-brand assets without a dedicated design resource.
Most popular social media platforms
For more detailed research, read our report on the most popular social media apps.
Meta dominates the global social media landscape, owning three of the top four most popular platforms (Facebook, Instagram, and WhatsApp) by number of users.
- Facebook remains the world’s largest social media platform with 3.07 billion monthly active users.
- YouTube ranks second, reaching 2.53 billion monthly users.
- Instagram and WhatsApp are tied for third place, each serving 2 billion users monthly.
- TikTok holds the fifth spot, with a massive 1.59 billion monthly active users.
- WeChat is the leading Chinese platform, with 1.38 billion users.
Sources
- Number of social media users worldwide from 2017 to 2028
- Number of internet and social media users worldwide as of February 2025
- Daily time spent on social networking by internet users worldwide from 2012 to 2024
- Digital 2025: Global overview report
- End of a decade: Here’s how social media has evolved over ten years
- How many people use social media in 2024?
- Most popular social networks worldwide as of February 2025, by number of monthly active users
- Daily time spent on social networking by internet users worldwide from 2012 to 2024
- Digital 2025: The United States of America
- Social media use in 2021
- Distribution of social media users in the United States as of February 2025, by gender
- Americans’ social media use
- The time we spend on social media
- Digital 2025: Canada
- Number of social media users in Canada from 2020 to 2029
- Distribution of social media users in Canada as of January 2021, by age group and gender
- Number of internet and social media users in the United Kingdom (UK) as of January 2025
- Distribution of social network users in the United Kingdom as of September 2024, by age group
- Social media audiences in the United Kingdom as of February 2025, by gender
- Most popular social media platforms in the United Kingdom (UK) as of the third quarter 2024, by usage reach
- Average daily time spent using media in the United Kingdom (UK) in the 3rd quarter 2024
- Digital 2025: India
- Social media statistics for India [updated 2025]
- Use of social media platforms among people in India as of January 2022, by age group
- Digital 2025: China
- Monthly usage of major social media platforms in China as of 3rd quarter 2024
- Digital 2025: Japan
- Share of internet users who use social media in Japan in 2023, by age group
- Active social network penetration in selected countries and territories in 2025
- Number of social network users worldwide as in 2025, by region
- Gen Z, millennials grow their social media presence through 2027
- Digital 2025: The state of social media in 2025