Visuals Maker From Piktochart
Try an easy-to-use infographics, presentations, and reports builder that helps you make visuals quickly, online. No graphic design skills needed.
Make your own infographic, presentation, report, flyer, or social media graphic
With Piktochart’s design tool, you can start from a template or create a visual from scratch. The free library of images, icons, illustrations, and templates saves time, enabling you to create a beautiful visual easily.
Brand assets and data visualization in one editor
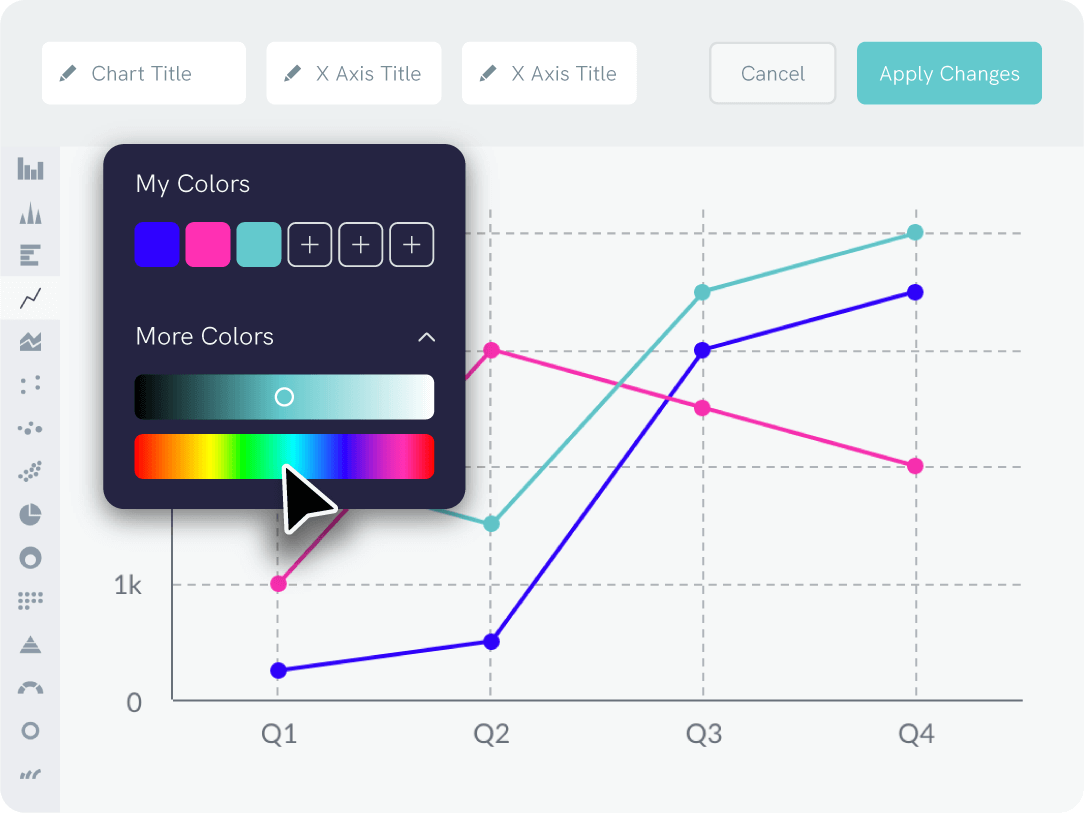
Your custom color palette and uploaded fonts will be added to the editor so that you or your team can easily apply them to any project. Furthermore, link up an Excel or Google Sheets file to easily create graphs that automatically update when your data does.
Ready to see Piktochart in action? Start designing for free!
Try our easy visuals maker at no cost and upgrade when you’re ready. Collaboration features and much more await!
My favorite is @piktochart – it’s the only tool I pay for every year. Very responsive support, too, the few times I’ve needed it.
— Nancy Watson (@NancyWYogini) January 21, 2020
Our poster turned out really well. I made it using @piktochart and it was crazy simple to do! #EDU19 pic.twitter.com/g1lMB82zBc
— Eric Mosterd (@emosterd) October 16, 2019
A3: I am thankful for all google things— and @piktochart. Love making Infographics to visualize, connect and align the work happening in our county and building. #forsythpln
— Jordann Aler (@JordannAler) November 22, 2019
Ss produced some great work to start the year using @piktochart! Created travel brochures/infographics on some of the amazing physical features of the US! These projects were so well done & look amazing! Check them out! #EdTech#MakeLearningFun #HistoryTeacher pic.twitter.com/UFDOEwFkDz
— Matt Vosburgh (@Coachy_V) August 19, 2019
Thank you @piktochart for allowing my students to show what they learned in a new exciting way. @VictoriaCurry77 @jenschin @gabEEinDC Love seeing my students create their own infographics that allow me to also track data of understanding. pic.twitter.com/7ZWMGXlblL
— Alyssa Cruz (@alyssacruz5612) December 2, 2019
Over 11 million users worldwide create graphics with Piktochart
Ready to make your own visual?
Create a Piktochart account.