Calculate How Much it Costs to Create a Visual Without Piktochart

How many visuals
are you creating?
+25% training, briefing and revisions fee
This project would cost:
${{ calculatedCost }}
New Calculation
Create a visual for $0 »
Use Piktochart to create quality visuals at a fraction of the cost of hiring a graphic designer

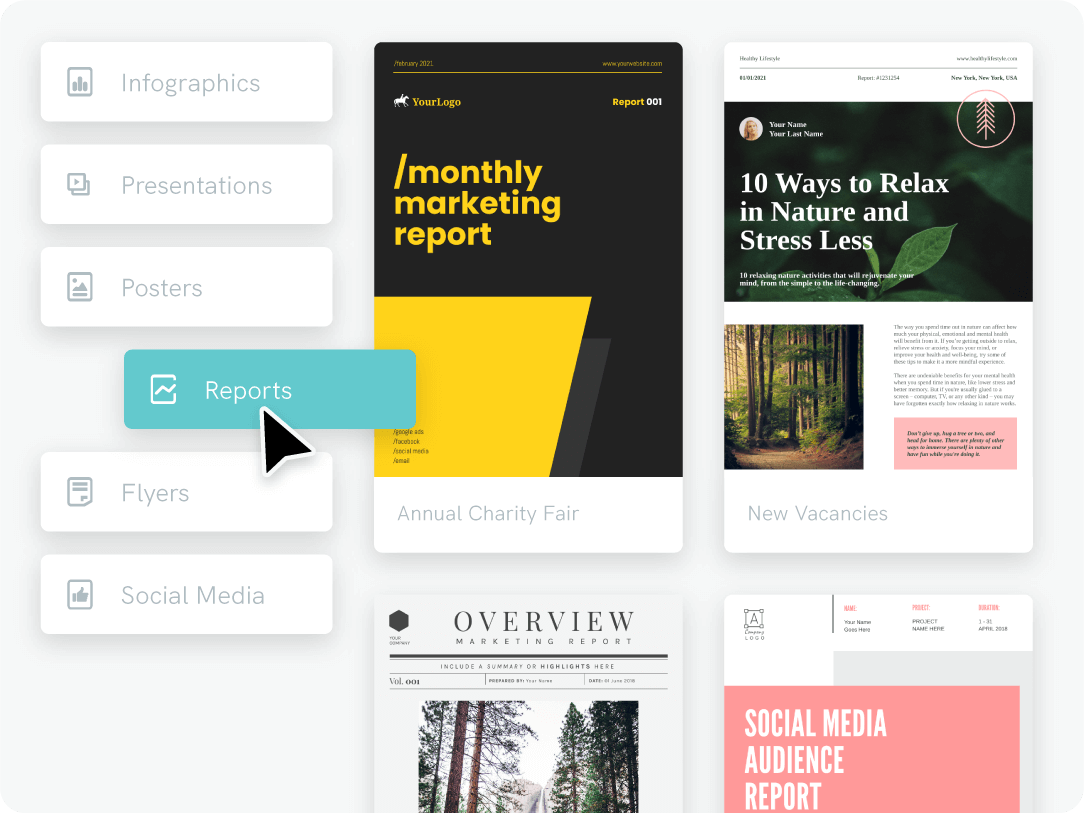
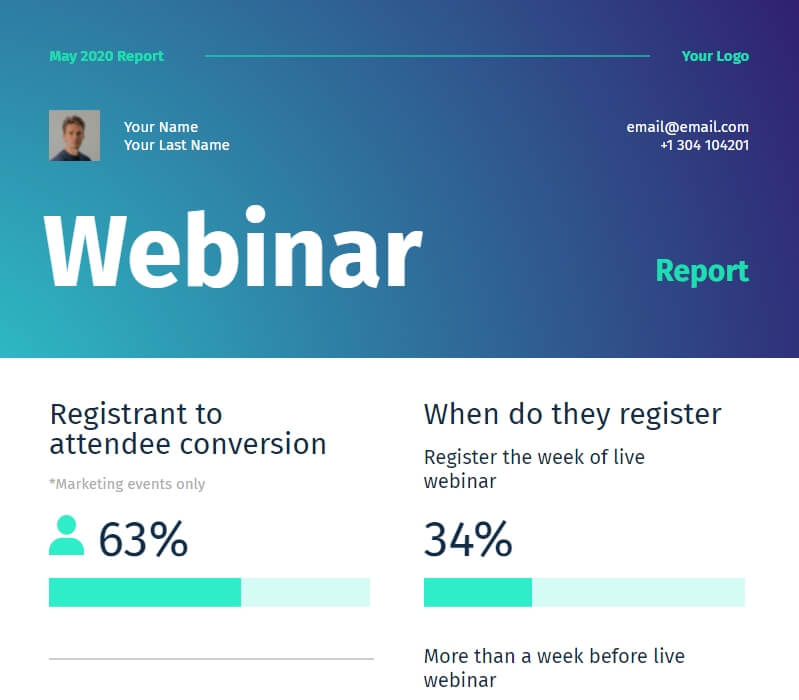
Templates
Create professional content with templates
No need to start from scratch. Choose from a library of over 800 infographic presentations, reports, social media graphics, and print templates designed by visual communication experts. Wherever your ideas take you, our ready-made templates get you there faster an cheaper than hiring a freelance designer.
Get Started
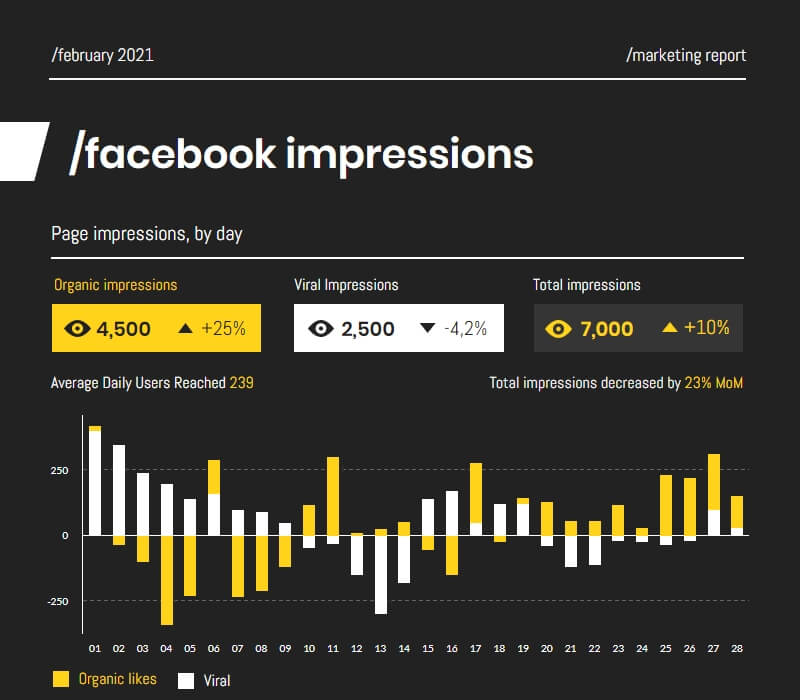
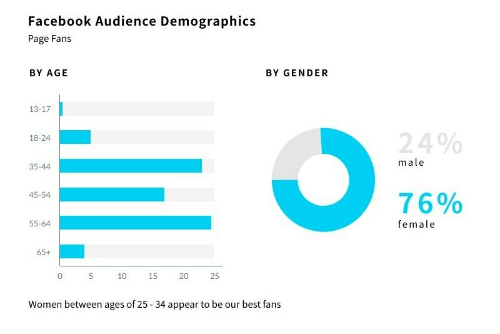
Visualize your data with charts and maps
With Piktochart’s robust charts and maps you can quickly translate your data into an infographic that will grasp the attention of your audience. Link up an Excel or Google Sheets file to easily create graphs that automatically update when your data does.
Get Started
Asset Library
Put a personal stamp on it
Upload your own images or choose from a large library of high-resolution photos, beautiful illustrations, and icons. Want to customize a photo in a ready-made template? No problem. Just drag and drop. Snap. You’re done!
Get Started
Collaboration
Collaborate with your team
Bring your team members into one single location. Share your visual work, your brand assets, and review your peers’ work on the fly. With Piktochart for Teams, everyone’s on the same page. Finally.
Get StartedCheck out some of our templates


Over 6M Users Worldwide Design with Piktochart
Frequently Asked Questions (FAQs)
Contact us if you have any other questions