Most mental health content fails for one of two reasons. It is either too clinical to feel human, or too vague to actually inform anyone. A good infographic threads that needle: it presents real information without sounding like a pamphlet from a waiting room wall, and it looks calm rather than alarming on a subject where alarm tends to shut people down instead of opening them up.
That balance matters more here than it does for almost any other infographic topic. Our own research into mental health statistics for 2026 found that 39% of workers still worry that disclosing a mental health condition to their employer would hurt them professionally, according to the American Psychological Association. Stigma like that does not move because someone reads a paragraph of statistics. It moves, gradually, when the information around a subject stops looking like a warning label and starts looking like something a person would actually want to look at.
Below are 12 real examples pulled from Piktochart’s own mental health infographic templates, organized by the job each one is doing: awareness, workplace communication, self-assessment, and data. Every template links directly to the live version so you can open and customize it yourself.
Awareness and Campaign Infographics
1. Mental Illness Awareness
The Mental Illness Awareness flyer is built for the job most awareness material actually needs to do: get someone’s attention in a feed or on a bulletin board, then hand them one clear message rather than a wall of text. Awareness formats work best when they resist the urge to explain everything at once, and this one is built around a single headline moment.
2. World Mental Health Day
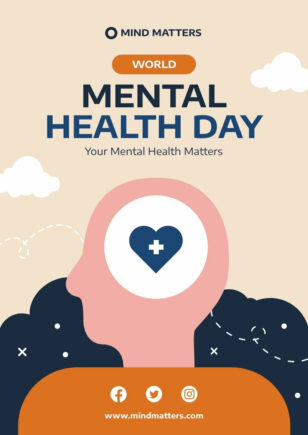
Piktochart has several templates built specifically around the annual World Mental Health Day observance, including a creative event poster variant. Awareness-day content has a short shelf life by design, which makes a fast, templated starting point more valuable than a from-scratch design process every organization would otherwise repeat every October.
3. Mental Health Awareness Month
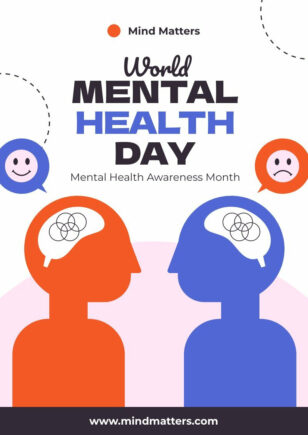
The Mental Health Awareness Month poster extends that same campaign logic across a full month rather than a single day, which suits organizations running a sustained internal or public campaign rather than a one-off post.
Workplace and HR Infographics
4. Mental Health Days at Work
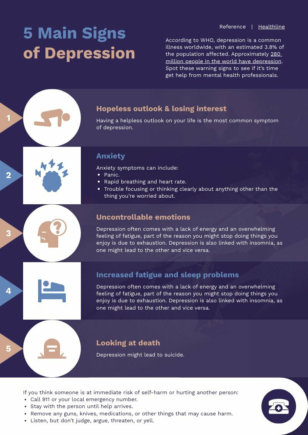
The Mental Health Days at Work poster is a direct response to the workplace disclosure problem the data points to. Normalizing mental health days as a routine part of workplace policy, in writing, on a poster employees actually see, does more to reduce the stigma our own research measured than a policy buried in an employee handbook ever will.
5. Poster About Mental Health Awareness
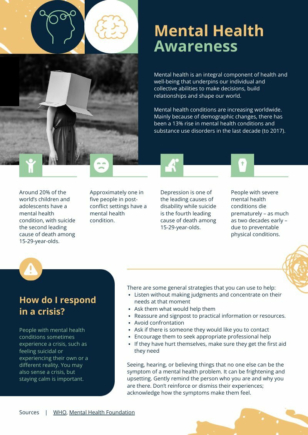
Built for break rooms, HR bulletin boards, and internal wellness campaigns, the Poster About Mental Health Awareness template is designed to sit in a physical workplace rather than a social feed, which changes the design math: it needs to read clearly from a few feet away, not from a thumbnail.
6. Modern Mental Health Check
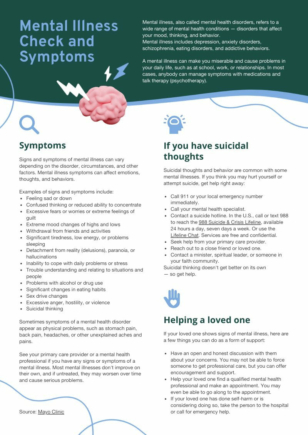
For organizations running regular wellbeing check-ins rather than one-time campaigns, the Modern Mental Health Check poster format supports a recurring communication cadence rather than a single announcement.
Self-Assessment and Checklist Infographics
7. Mental Health Symptom Checker
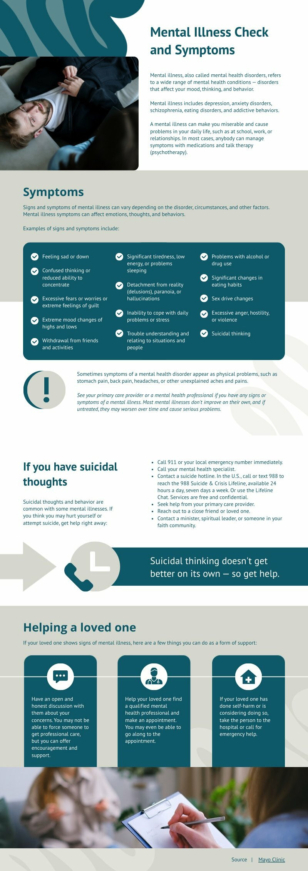
The Mental Health Symptom Checker is one of the more clinically useful formats on this list. Checklist infographics lower the barrier to self-reflection by breaking an abstract question, “how am I actually doing,” into a short list of concrete, answerable prompts, which is a meaningfully different cognitive task than reading a paragraph about warning signs.
8. Simple Mental Check In Questions
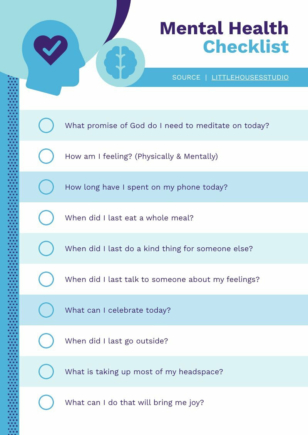
The Simple Mental Check In Questions template applies that same checklist logic to a lighter, more frequent use case, a quick self-check rather than a formal symptom review, which suits recurring use in a classroom, a team meeting, or a personal routine.
9. Mental Health Check In
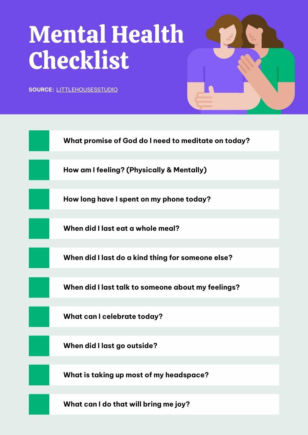
The Mental Health Check In template rounds out the checklist category with a format built around routine use rather than a single moment, the kind of material a school counselor or team lead might reuse weekly rather than post once.
Data and Statistics Infographics
10. Mental Health Statistics

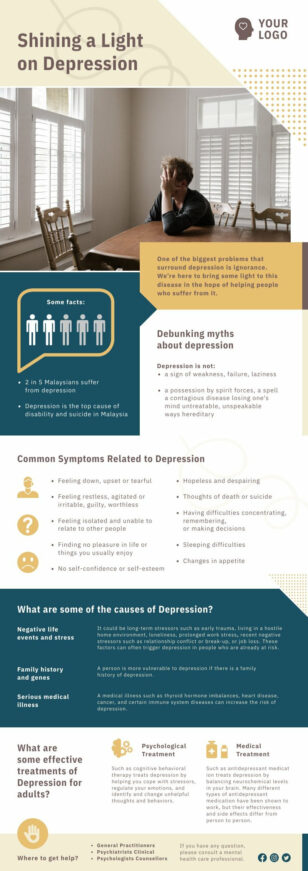
For anyone building on the kind of research in our statistics report, the Mental Health Statistics template is a tall, vertical format built specifically to carry a sequence of data points, which suits a stat-heavy piece far better than a single-panel poster would.
11. Modern Mental Health Statistics

A second, more contemporary take on the same category, the Modern Mental Health Statistics template is worth comparing against the previous one before choosing, since the right visual style depends heavily on the audience: a clinical or academic setting reads differently than a social awareness campaign.
12. Children’s Mental Health Pictogram
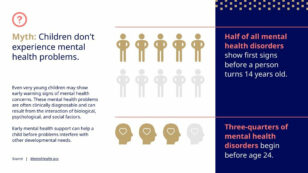
The Children’s Mental Health Pictogram trades charts for icon-based counts, a format that tends to work better than a bar chart when the goal is fast, intuitive comprehension rather than precise comparison, particularly for content aimed at parents, teachers, or a general audience rather than researchers.
What Makes These Work as a Group
A few patterns hold across all twelve. None of them lean on harsh reds or high-contrast alarm colors, which lines up with the same design principle in our statistics report: this subject does not need to look like a warning to be taken seriously. Most separate a single message per template rather than trying to cover an entire topic in one visual, which is the same discipline that makes a good statistics infographic work. And several are built for recurring use (weekly check-ins, annual campaigns) rather than a single publish-and-forget post, which reflects how mental health communication actually gets used inside real organizations.
Building Your Own
If none of the twelve above fit exactly what you need, there are two ways to get to a finished piece from here.
Start with a template if the subject matter is sensitive and you want the design risk handled for you. The full mental health template library has more than 30 templates beyond the twelve covered here, and A Simple Guide to Piktochart for Beginners covers the editor basics in a few minutes if you are new to the tool.
Start with AI if you are working from your own data or text and want a first draft fast. Piktochart’s AI infographic generator can take a pasted document, a set of statistics, or even a rough outline and produce a structured layout in under a minute, or you can try our Infographic maker too. This walkthrough shows the process end to end: Text to Infographics in One Click Using AI.
For the broader design thinking behind any of this, Piktochart’s guide to infographic design tips and the infographic layout cheat sheet both cover principles that apply directly to a sensitive subject like this one: visual hierarchy, color restraint, and knowing when a chart format fits better than a poster.
Frequently Asked Questions
Are Piktochart’s mental health templates free?
Piktochart offers a selection of free mental health templates that can be customized in the browser-based editor and downloaded without a paid subscription.
Who typically uses these templates?
Therapists, school counselors, HR and wellness teams, and mental health nonprofits are the most common users, based on the range of formats available: client-facing worksheets, workplace posters, and public awareness campaign material all serve different audiences.
What file formats can I export a finished infographic in?
Templates can be exported as PNG or PDF for print or digital sharing, or shared as a live link directly from the editor.
Should mental health infographics use bright colors to grab attention?
Generally no. Calming, muted palettes tend to perform better for this subject than high-contrast or alarming color choices, since the goal is usually to feel approachable rather than urgent.
Is there real data I can use to build a statistics-based mental health infographic?
Yes. Our Mental Health Statistics 2026 report compiles verified, sourced figures from SAMHSA, NIMH, the CDC, and the APA that are safe to cite directly.