You already know your competitors exist. What most teams don’t have is a consistent way to track what those competitors are actually doing, so every quarter turns into a scramble to remember who launched what and when.
A competitive analysis template fixes that. It gives you one place to log competitor pricing, features, positioning, and strategy so you can compare them side by side instead of relying on scattered notes and old screenshots.
This guide walks through what to include in a competitive analysis template, how to fill one out step by step, and a set of free, ready-to-use templates you can start customizing right in Piktochart.
What a Competitive Analysis Template Actually Does
A competitive analysis template is a structured document, usually a table, matrix, or infographic, that organizes information about your competitors into consistent categories. Instead of a folder of random research, you get a single visual reference that answers three questions:
- Who are we actually competing against, directly and indirectly?
- Where do they beat us, and where do we beat them?
- What should that change about our roadmap, pricing, or messaging?
The format matters less than the consistency. A template forces you to gather the same information for every competitor, which is what makes the comparison useful in the first place.
What to Include in a Competitive Analysis Template
Most competitive analyses fall apart because they try to cover everything at once. Keep your template focused on these seven components, and drop the ones that don’t matter to your specific decision.
1. Company snapshot
Founding year, headcount, funding stage, and target market. This context explains why a competitor makes the decisions it makes. A well-funded startup competes on growth and features. A bootstrapped one competes on price and retention.
2. Product and feature comparison
A row-by-row list of core features, marked as present, absent, or partial for each competitor. This is usually the section stakeholders look at first, so keep the feature list specific rather than generic.
3. Pricing and packaging
Plan tiers, price points, billing cycles, and what’s gated behind higher tiers. Note free trials and freemium limits too, since those shape how prospects compare you before they ever talk to sales.
4. Marketing and positioning
How does the competitor describe itself in its own headlines? What keywords does it rank for? Which channels does it show up on? This section tells you how a prospect encounters that competitor before they encounter you.
5. Strengths and weaknesses
A short, honest list for each competitor. Pull this from review sites, sales call notes, and win-loss data rather than assumptions.
6. SWOT summary
Once you’ve gathered the sections above, a SWOT analysis turns raw research into a strategic read on where you stand. Our guide on turning a SWOT into a TOWS strategy matrix is a useful next step once your competitive research is in place.
7. Market position or competitor map
A visual plot of competitors by price, feature depth, market share, or any two axes relevant to your market. This is a different exercise from the row-by-row comparison above; it’s about where competitors sit relative to each other, not what each one contains. Our competitor mapping template guide covers this in more depth if positioning is your main goal.
How to Fill Out a Competitive Analysis Template, Step by Step
Step 1: Identify your real competitor set
List direct competitors (same product, same audience), indirect competitors (different product, same problem), and any emerging competitors worth watching. Three to five direct competitors is usually enough for a working document. More than that and the comparison gets too diluted to act on.
Step 2: Gather primary sources
Pull data from competitor websites, pricing pages, app store reviews, G2 and Capterra listings, and your own sales team’s call notes. Avoid relying on secondhand summaries. Pricing pages change often enough that a screenshot from six months ago can already be wrong.
Step 3: Fill in the template consistently
Complete the same fields for every competitor before moving to analysis. Half-filled rows are the most common reason competitive analyses go stale, since it’s tempting to skip a competitor once the research gets tedious.
Step 4: Identify the gaps and the overlaps
Look across rows, not just down columns. Where do all your competitors agree (table stakes you can’t skip) and where does no one compete well (a potential opening)?
Step 5: Turn it into something your team will actually use
A spreadsheet is fine for the research phase, but a visual summary is what gets referenced in planning meetings months later. It’s also worth cross-checking findings against your own marketing plan so competitive gaps translate into positioning decisions, not just a document nobody revisits.
Free Competitive Analysis Templates You Can Use Right Now
Each of these is a live Piktochart template. Click through, sign up for free, and start editing with your own competitor data.
Competitive Analysis Infographic Template

A yellow monotone infographic layout built for summarizing your findings into something you can share outside the research team. Good for a leadership readout once the deep-dive work is done.
Competitor Comparison Infographic Template
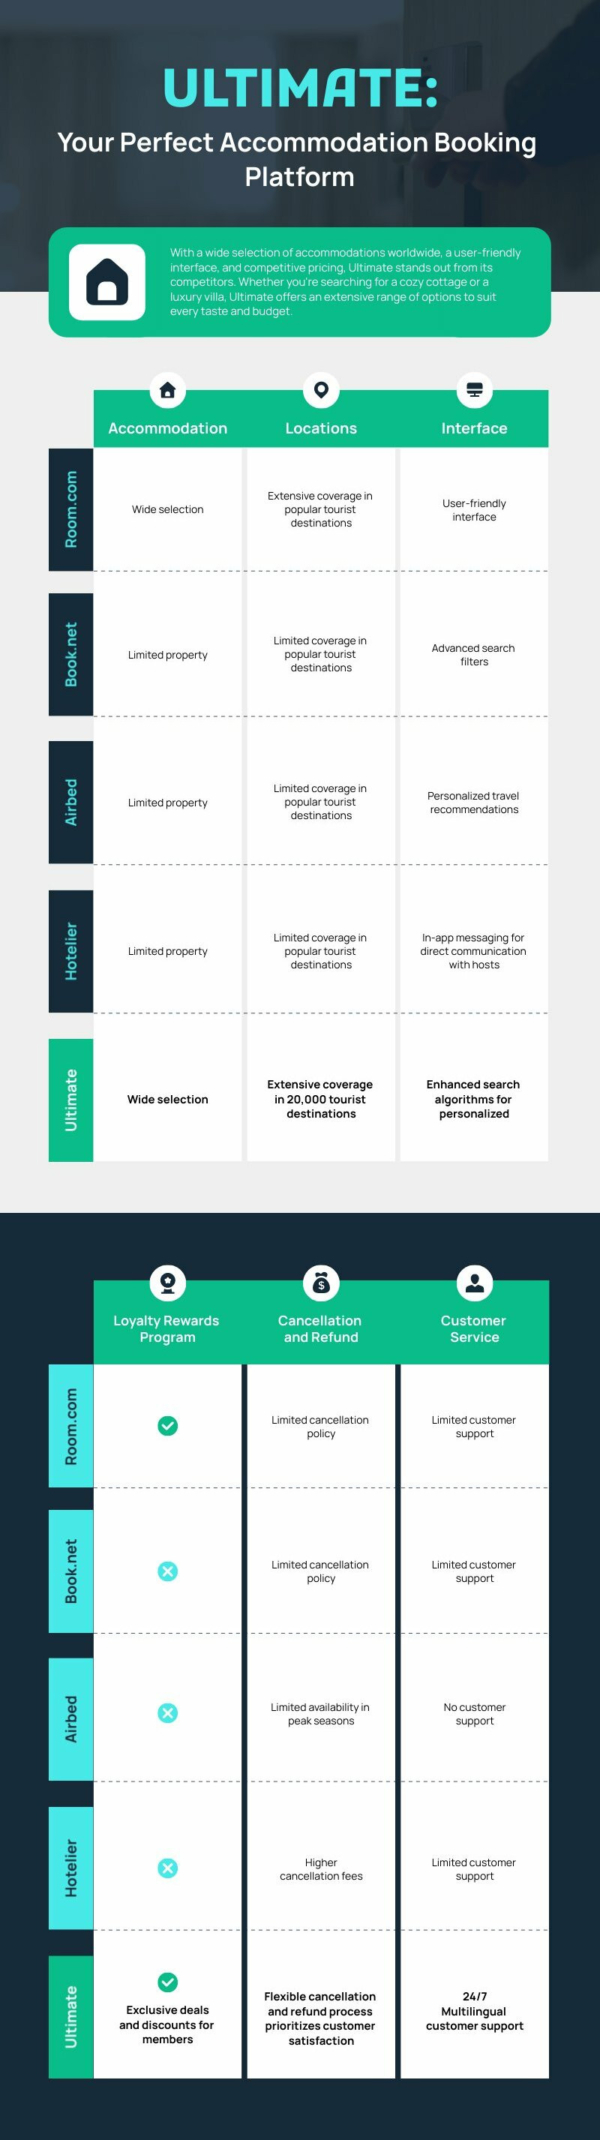
A side-by-side comparison layout in a green color scheme, built specifically for laying competitor strengths and weaknesses next to your own.
Competitor Analysis Infographic Template

A blue and green infographic template for a broader competitor rundown, with room for company logos, figures, and short descriptive blocks per competitor.
Competitive Analysis Quadrant Graph Template
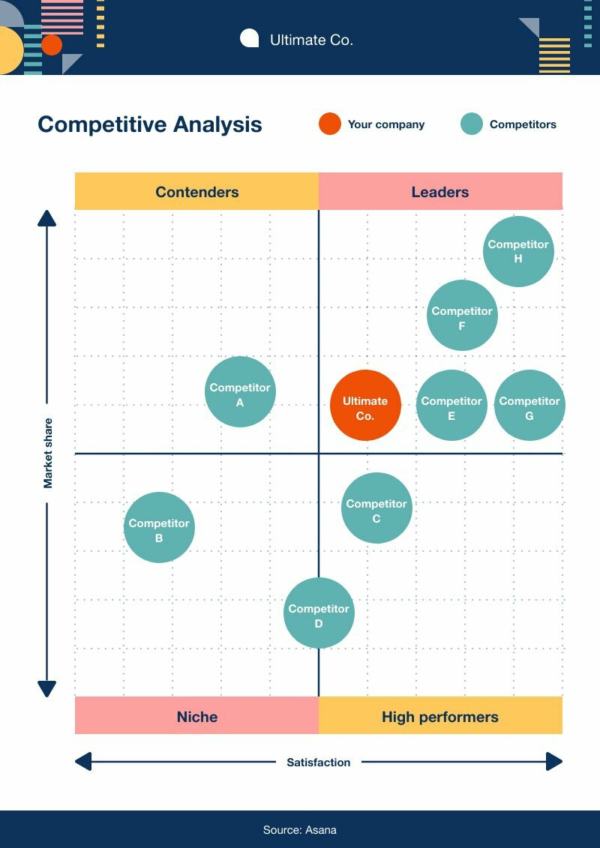
A quadrant chart plotting competitors across two axes (for example, price versus features), with sections for leaders, contenders, niche players, and high performers. This is the template to reach for when positioning matters more than feature lists.
Competitive Matrix Template
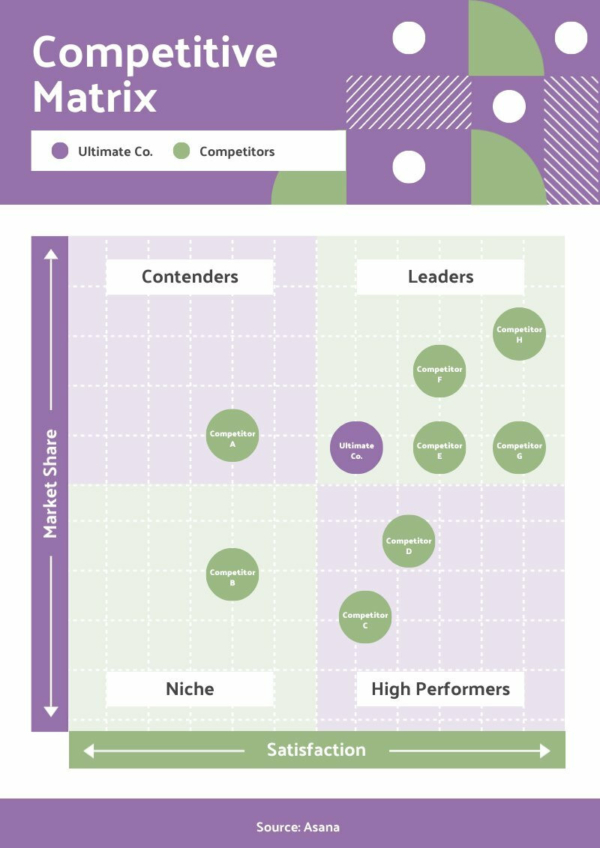
A clean diagram format for a straightforward row-by-row matrix, best when you’re evaluating several products or services against the same criteria.
Competitive Analysis Presentation Template

A 10-block presentation deck with pie charts, bubble charts, and line graphs built in, for when the analysis needs to be walked through live rather than read on a page.
Looking for more formats? Browse the full comparison infographic template library. And if your goal is specifically to map where competitors sit in the market rather than compare their features line by line, the competitor mapping template guide covers that format and includes a dedicated template for it.
Common Mistakes to Avoid
- Comparing on features alone. Pricing, positioning, and customer sentiment often matter more than a checklist of features.
- Treating it as a one-time project. Competitor pricing and features change; revisit the template on a set cadence, such as quarterly.
- Only tracking the obvious competitors. Indirect competitors and new entrants are often what actually changes a market.
- Building it and never sharing it. A competitive analysis that lives in one analyst’s folder doesn’t influence any decisions.
Frequently Asked Questions
What’s the difference between a competitive analysis and a SWOT analysis?
A competitive analysis is research: gathering data on what competitors do. A SWOT analysis is a framework for interpreting that research into strengths, weaknesses, opportunities, and threats. Most teams do a competitive analysis first, then summarize the findings in a SWOT.
How often should I update a competitive analysis template?
Quarterly is a reasonable default for most markets. Fast-moving categories, like software with frequent feature releases, may warrant a monthly check on pricing and feature pages specifically.
How many competitors should I include?
Three to five direct competitors is enough for most decisions. Add indirect competitors only if they’re actively pulling customers away from you, not simply because they exist in the same broad category.
What tools do I need to build a competitive analysis?
Spreadsheets work for the research and data-gathering phase. A design tool like Piktochart is better suited for the summary you’ll actually present to stakeholders, since it turns a dense spreadsheet into something people will read.
Ready to build your own? Sign up for a free Piktochart account and start from any of the templates above.