The best canva alternatives in 2026 give you drag-and-drop design power, professional templates, and brand kit controls: without Canva’s rising price tag. Whether you are a marketer rushing to publish social graphics, an HR lead building internal newsletters, or a consultant polishing a client deck, the right web-based design platform can save you hours every week.
Canva has earned its reputation. No argument there. But its recent team-pricing jump (from roughly $26/month to $45/month for five seats) has pushed many professionals to explore other options. Some users need deeper data visualization. Others want a lighter tool with no learning curve; one they can open in a browser and master in minutes. Still others are tired of sifting through premium-locked assets every time they search for an icon or illustration.
This guide compares 10 beginner-friendly design platforms across features, pricing, AI capabilities, and team economics so you can pick the right Canva alternative without trial-and-error.
Not sure if it’s time to look beyond Canva? This short video covers the key limitations that push teams toward alternatives. For the full comparison of 10 options, read on below.
The 10 best Canva alternatives for 2026
Here are the 10 best Canva alternatives in 2026, both free and paid, with a quick breakdown of what each is best for:
- Piktochart — B2B infographics, reports, AI-generated visuals
- Visme — interactive presentations and animated dashboards
- Snappa — one-off social graphics, no AI
- Pixlr — browser-based photo editing with generative AI
- VistaCreate — budget social media tool with animated templates
- Adobe Express — Creative Cloud users, cheap-vs-Canva team pricing
- Fluer (formerly Desygner) — franchise marketing, mobile-first SMBs
- Pixelied — budget design and mockup suite for solo creators
- Microsoft Designer — free AI-first design (Microsoft 365 / Copilot bundle)
- PicMonkey — deep photo editing (in maintenance mode)
The 10 options below will help you find an online graphic design tool with the right feature set, pricing, and AI depth for your work.
1. Piktochart — Best for B2B professionals turning complex data into infographics, reports, and interactive visuals
Piktochart sits in the spot Canva struggles to fill: long-form infographics, internal reports, HR comms, and data-driven visuals. The 7-day free trial is short and gives you only 2 lifetime PNG downloads, but if your weekly deliverables include charts, maps, or layered data stories, the AI infographic generator and live data widgets recover the Pro subscription cost inside a few hours of work.
Pros
- 1,000+ infographic templates across 20+ formats with native chart and map widgets
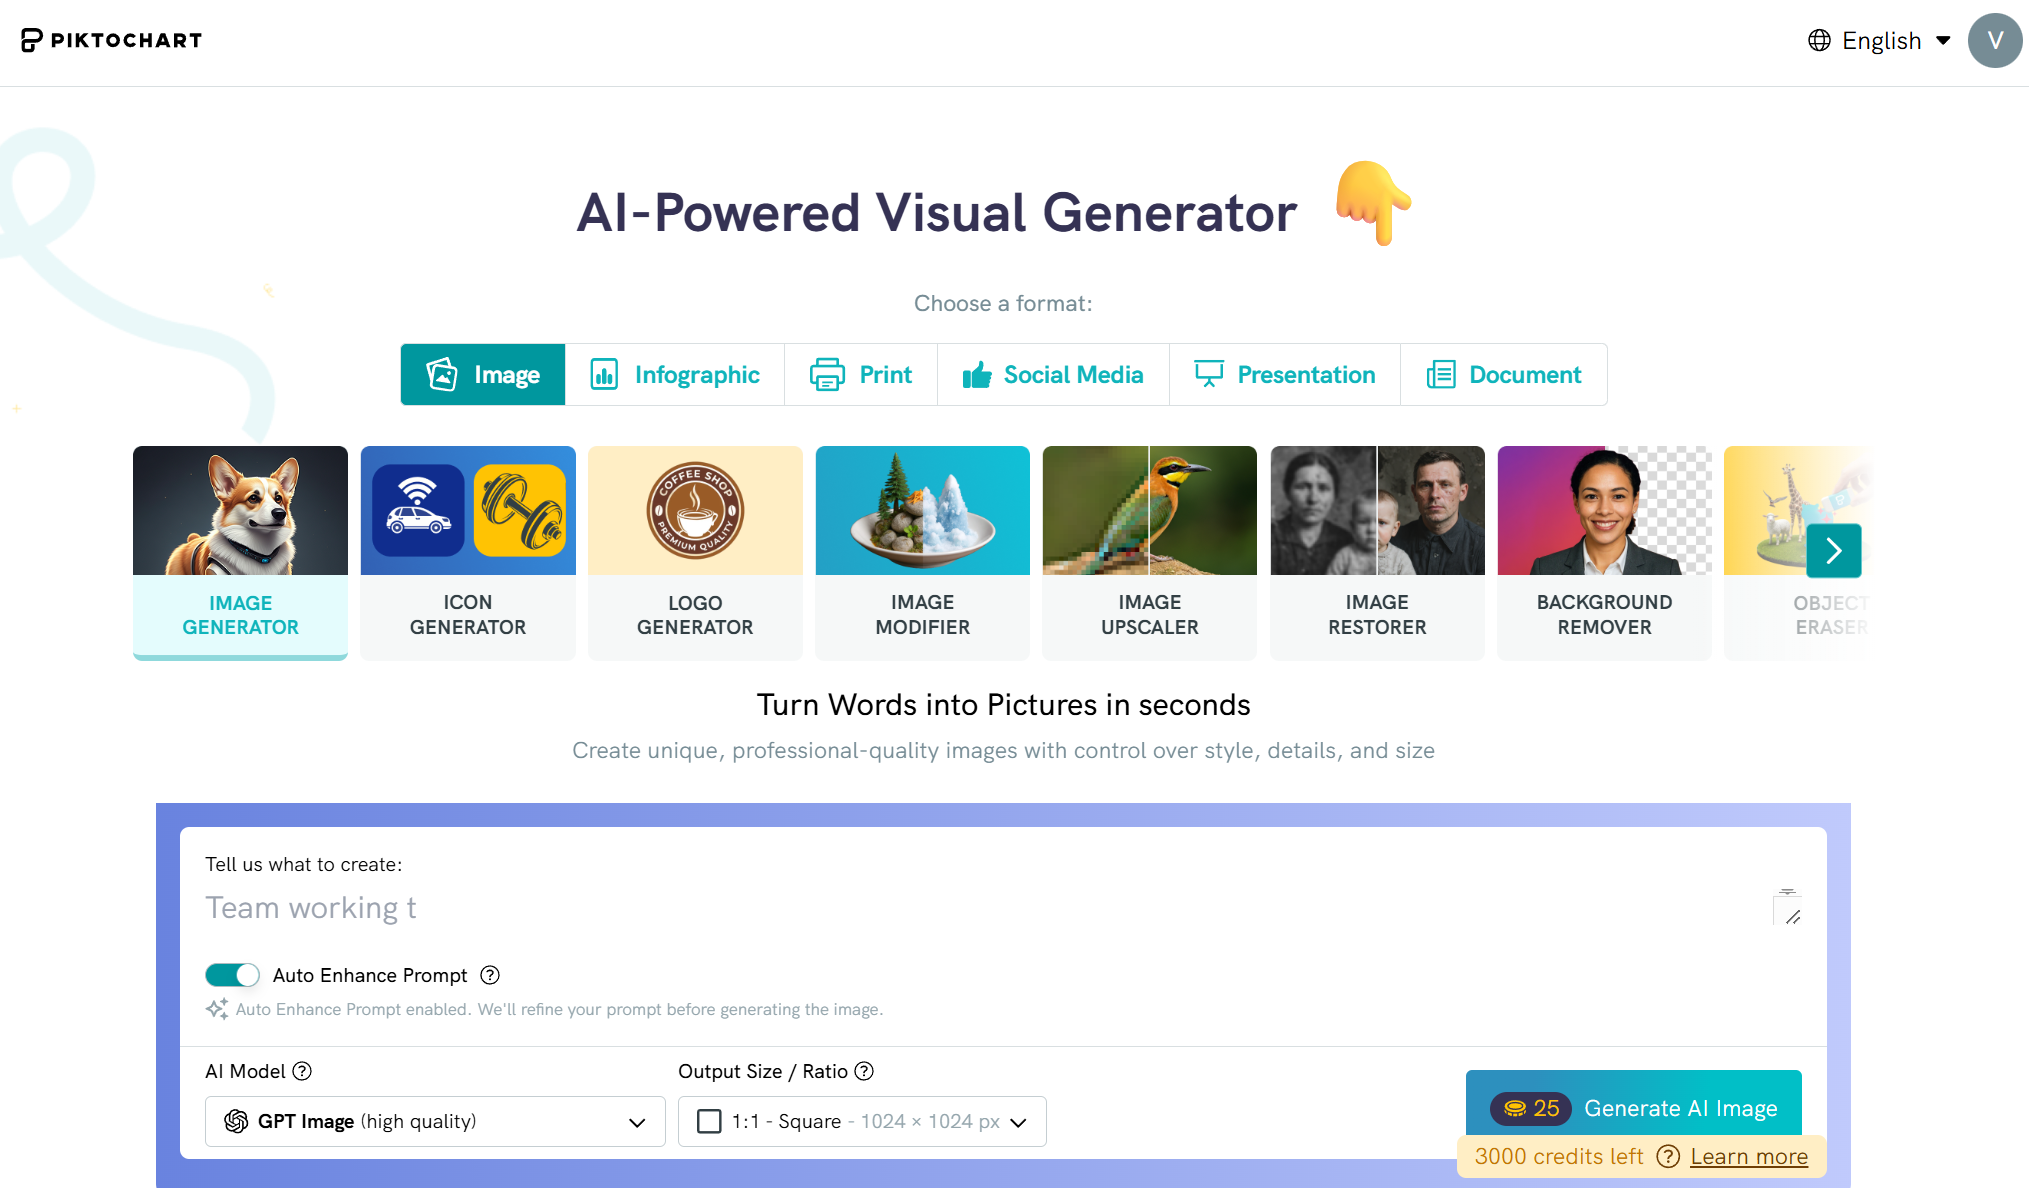
- Pikto AI Studio generates infographics, videos, and images from a single prompt — plus a ChatGPT plugin for in-thread design
- Pro starts at $14/month annual with 1,000 AI credits; Business is $24/month with 3,000 credits
- G2 4.5/391, Capterra 4.7/198, Trustpilot 4.7 — ratings hold up across all three platforms
Cons
- 7-day free trial with 2 lifetime PNG downloads, not a forever-free plan — if you need indefinite free tooling, look elsewhere first
- Chart label crowding on dense data is the most-cited complaint in user reviews
- Layout and typography control trail Adobe Express for users who want pixel-level adjustment
- Template search and filtering could be sharper
Pricing
- Free trial: 7 days, 60 AI credits, 2 lifetime PNG downloads
- Pro: $14/month annual or $29/month monthly — 1,000 AI credits, premium templates, PDF and interactive exports
- Business: $24/month annual or $49/month monthly — 3,000 AI credits, brand kit, team collaboration
- Enterprise: Custom
Piktochart is the right pick when your work is infographics, reports, or data-driven content more than once a month — marketing teams running quarterly reports, HR teams onboarding new hires, consultants packaging research for clients. It’s the wrong pick if you need a forever-free design tool, a print-shop layout engine, or a social-tile factory.
If you’re comparing Piktochart against Canva specifically, our side-by-side breakdown covers pricing, feature gaps, and the kinds of work each tool handles best.
Try Piktochart for yourself!
Sign up for free today2. Visme — Best for interactive presentations and animated data dashboards
Visme launched as a presentation and infographic tool and has steadily expanded into a full visual content suite. The biggest 2026 update: AI Designer (launched January 2024) now generates up to 10 pages across 100+ content types from a single prompt. Where Visme genuinely beats Canva is interactivity and animation depth — Visme can build an animated, embeddable dashboard you present live; Canva builds a static one.
Pros
- AI Designer generates multi-page outputs across 100+ content types from a single prompt, plus Brand Wizard pulls fonts, colors, and logos from a URL
- 40+ chart types with import from Excel, CSV, Google Sheets — interactive embeds, animated transitions, lead capture forms
- Stock library and template breadth across presentations, infographics, social, video, documents, and forms
- Capterra 4.5/719, G2 ~4.3 — solid ratings, especially among educators and marketers
Cons
- Pricing is per-user even at the individual tier — Starter $12.25/month, Pro $24.75/month annual — adds up fast for small teams
- Editor performance and sign-in bugs come up repeatedly in 2024-2025 Capterra reviews
- Free plan caps you at 5 active projects with watermarks and 10 AI credits
- Cluttered UI for first-time users — learning curve is steeper than Canva
Pricing
- Free: 5 active projects, watermarks, 10 AI credits, 500MB storage
- Starter: $12.25/user/month annual ($29 monthly) — 200 AI credits/month
- Pro: $24.75/user/month annual ($59 monthly) — 500 AI credits, brand wizard, lead capture
- Pro for Teams / Enterprise: Custom — unlimited AI, advanced admin, SSO
Visme is the right pick if your work mixes presentations, interactive content, and infographics — analyst teams publishing dashboards, marketers running gated lead forms, educators preparing animated lecture decks. It’s the wrong pick if you need a usable free plan or want flat-seat (rather than per-user) pricing.
If you came to Visme via the Canva-pricing pain, take a look at our Piktochart vs Visme comparison — Piktochart undercuts Visme on per-seat economics for infographic-first teams.
3. Snappa — Best for one-off social graphics when you don’t need AI or interactivity
Snappa is the simplest tool in this list. No AI, no interactive content, no mobile app, JPG and PNG export only. That’s a feature, not a bug, if your needs are equally simple — a Twitter card, a blog header, a quick promo. Worth knowing: Snappa hasn’t shipped a major update in over two years, and reviews trail off after 2023. Use it for what it does, but don’t make it a long-term toolchain commitment.
Pros
- 5M+ stock photos baked in — library is genuinely large for a tool this simple
- Fastest learning curve in this list — you can ship a graphic in under 5 minutes from sign-up
- Pro at $10/month annual covers unlimited downloads, brand kit, and team folders without seat-pricing friction
- Background removal is one click and works well for product shots and portraits
Cons
- No AI features — not text-to-design, not magic edit, not AI image generation
- Maintenance-mode signals: footer dated 2025, no public changelog, no recent feature launches, ~570 LinkedIn followers
- Export is JPG and PNG only — no SVG, no PDF, no editable formats
- No mobile app, and no signal that one is coming
Pricing
- Starter (Free): 3 downloads per month, basic templates
- Pro: $10/month annual or $15/month monthly — unlimited downloads, brand kit, custom font upload
- Team: $20/month for up to 5 users (annual)
Snappa is the right pick for solo creators or bloggers whose design needs are genuinely simple and don’t include AI or interactivity. It’s the wrong pick if you need infographics, reports, AI-generated content, vector or PDF export, mobile editing, or a tool actively under development.
4. Pixlr — Best for browser-based photo editing with built-in generative AI
Pixlr is the photo-editor pick in this list — Photoshop-style layered editing in the browser, plus a deep AI suite (Generative Fill, Expand, Remove Object, Super Scale). Pixlr E covers advanced workflows; Pixlr X is the beginner mode. Pricing is materially cheaper than Adobe — Plus is $1.49/month annual — but the free tier shows ads and caps you at 3 saves per day.
Pros
- Layered photo editing with masks, blend modes, adjustment layers — closer to Photoshop than any free competitor
- AI suite covers Generative Fill, Background Remove, Object Remove, Super Scale, Style Transfer, Image Generator, Video Generator
- Pricing undercuts every comparable Adobe tier — Plus $1.49/month, Premium $6.49/month, Team $9.91/month per seat
- Mobile and desktop apps in addition to the web editor
Cons
- Free plan caps you at 3 saves per day and shows in-editor ads (sometimes fullscreen interstitials)
- AI image generation quality lags Firefly and Midjourney — credits are best spent on Generative Fill and editing tools
- Layout, multi-page documents, and infographic tooling are thin — Pixlr does photo editing well, but anything beyond a single-canvas design will feel cramped
- AI credit pool resets monthly — power users on Plus tier (80 credits/month) will burn through fast
Pricing
- Free: 3 saves/day, ~20 starter AI credits, in-editor ads
- Plus: $1.49/month annual — 80 AI credits/month, ad-free
- Premium: $6.49/month annual — 1,000 AI credits, Private mode
- Team: $9.91/month annual per seat — 5 seats, 1,000 credits each
Pixlr is the right pick when your work has shifted from layout to photo — product photography, social photo cleanup, AI-assisted retouching. It’s the wrong pick for layout-heavy designs, presentations, or infographics where a generalist tool serves better.
5. VistaCreate — Best for budget-conscious solopreneurs and social media managers
VistaCreate is what Crello became after Cimpress’s Vista acquired it in 2021 and rebranded the following year. The product still leans hard into social: animated stories, Reels and TikTok templates, and a free Brand Kit (which Canva tucks behind its Pro paywall). For a one-person business or a small social team running daily posts on a tight budget, VistaCreate covers most of what Canva does at the price of a streaming subscription.
Pros
- Animated social-media templates for Instagram, TikTok, and Reels are stronger than most tools at this price point
- Brand Kit, font upload, and team folder access are included on the free plan — Canva gates these behind Pro
- 200,000+ templates and 70M+ stock assets baked in
- Pro plan undercuts Canva Pro on annual price
Cons
- Trustpilot is dominated by billing complaints — auto-renewal, surprise charges, and a refund policy that voids itself if you’ve downloaded any design in the past 14 days
- AppSumo reviewers repeatedly call it “Canva in 2017, not 2025” — the roadmap is quiet
- No SVG export, no PDF with bleed, hard cap of 10 team seats — not viable for print agencies or larger teams
- Infographic and data-visualization tooling is shallow
Pricing
- Starter (Free): Brand Kit, 70K+ free templates, basic export
- Pro: $10/month annual or $13/month monthly — full library, animation, background remover, commercial license
- Team: Pro pricing per seat, capped at 10 users
VistaCreate is the right pick for solopreneurs and social-first content teams whose work lives on social feeds and ad creative. It’s the wrong pick for print, long-form reports, infographics, or anything beyond a 10-seat team.
6. Adobe Express — Best for Creative Cloud users and teams who want Adobe quality at Canva-undercutting prices
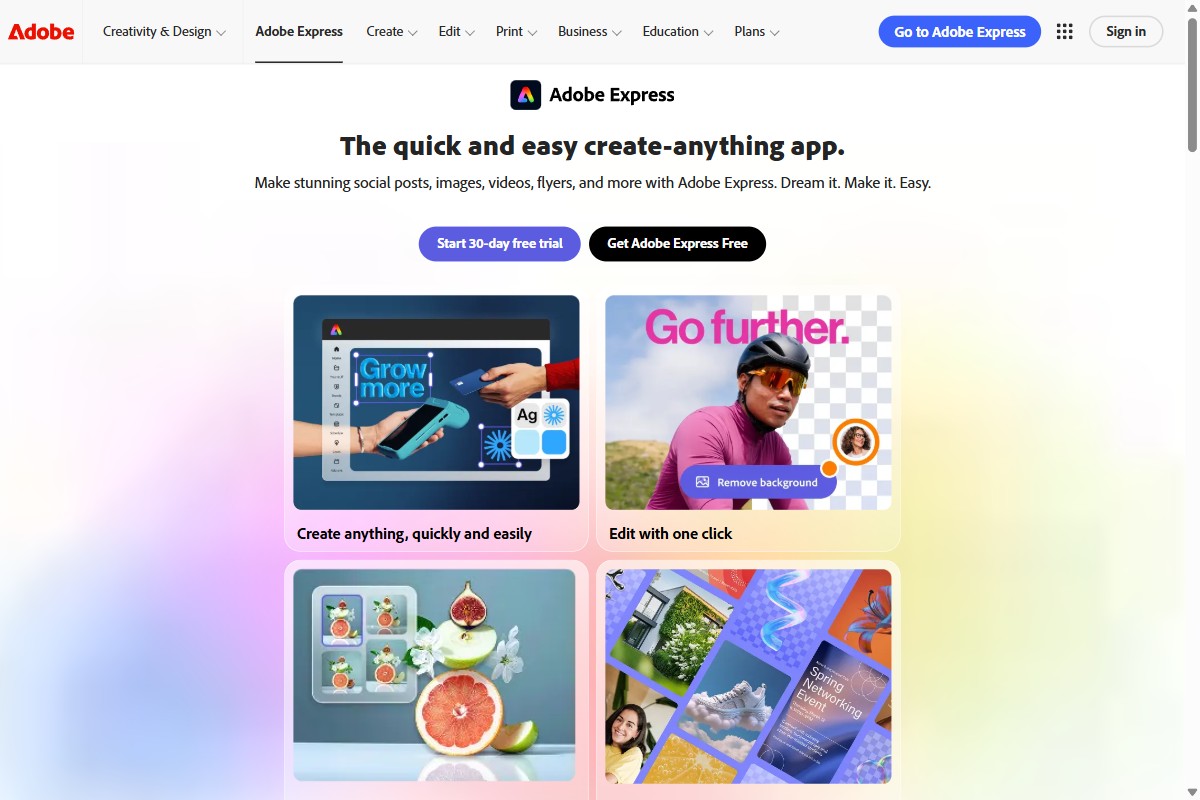
Adobe Express is the rebuilt successor to Adobe Spark, now positioned as Adobe’s answer to Canva. For Creative Cloud subscribers it shows up as a free, integrated extension of the suite — pull a Photoshop file in, edit a quick social asset out. For teams shopping for a Canva alternative, the surprising hook is the seat price: Adobe Express for Teams is $7.99 per seat versus Canva Teams’ $20.
Pros
- Firefly generative AI is genuinely competitive — review-site verdicts consistently call its output more “design-grade” than Canva Magic Studio
- Adobe Stock (147M+ assets), Adobe Fonts, and round-trip with Photoshop and Illustrator give designers a real ecosystem moat
- Teams pricing at $7.99 per seat undercuts Canva Teams ($20 per seat) — a strong angle for marketing and HR teams already buying Adobe
- Free plan is unusually generous — Firefly credits, templates, and brand kit included
Cons
- The “$9.99 a month” lead price is misleading once you include Creative Cloud apps and Stock — real total cost is 5-7x the headline
- Cancellation friction is the loudest reputational issue: lockout fear, billing surprises, and Adobe’s annual-plan early termination fee
- Export is flat only (PNG, JPG, PDF) — no editable round-trip back into Photoshop or Illustrator
- Data visualization, interactive content, and charting are weaker than Visme and well behind Piktochart
Pricing
- Free: Templates, Firefly Generate credits, basic editing, brand kit
- Premium: $9.99/month — full template library, premium fonts and stock, video editing, scheduling
- Teams: $7.99 per seat per month annual — admin console, brand controls, team libraries
Adobe Express is the right pick if you already pay for Creative Cloud, if your team is buying group licenses and Canva’s seat pricing is biting, or if you specifically need Firefly. It’s the wrong pick if you need explainer videos, interactive content, or chart-driven content where Visme and Piktochart serve better.
If your team is comparing Express against Canva right now, the seat price is the conversation worth having. If your team needs long-form visuals like infographics or reports, Piktochart covers that lane.
7. Fluer (formerly Desygner) — Best for franchise marketing teams and mobile-first SMBs needing locked brand templates
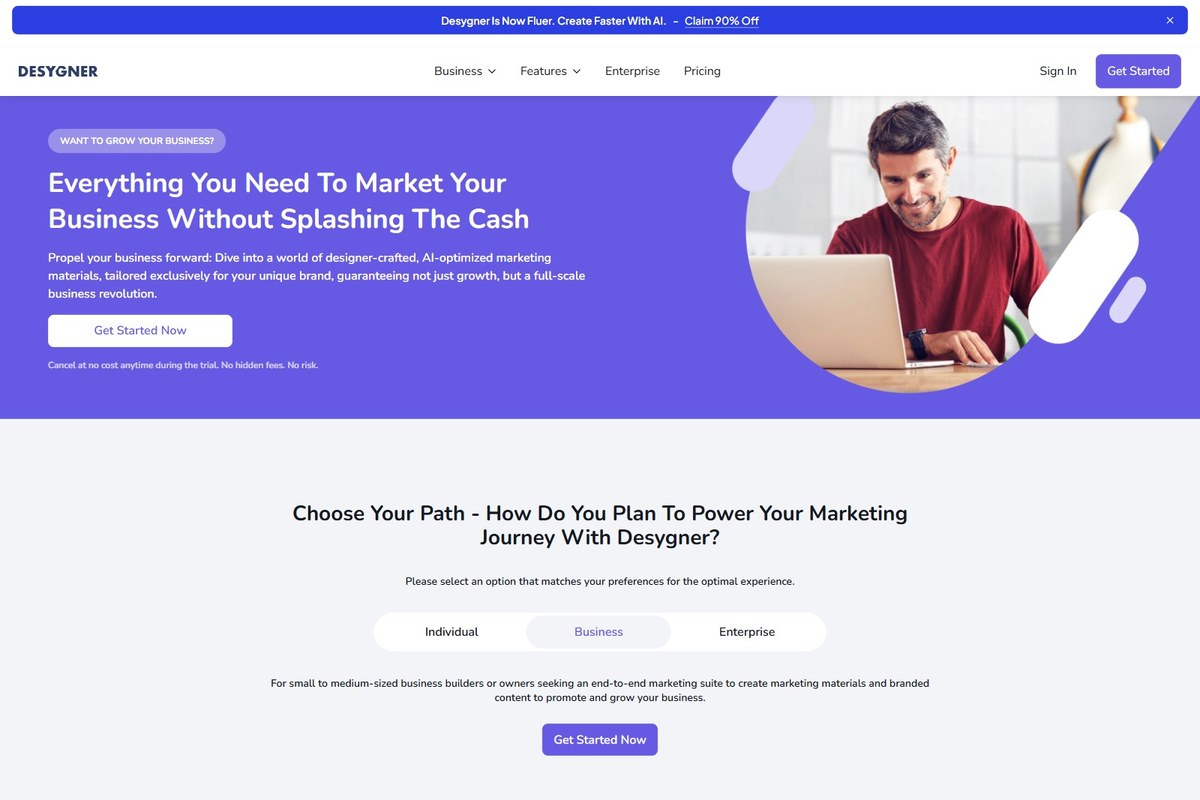
Fluer (the AI-first rebrand of Desygner, announced 2026) is the mobile-first design tool with a distinctive enterprise angle: lockable templates with element-level brand restrictions, sold to franchise networks via the We Brand sub-brand. On mobile it’s exceptional — 4.7/5 across 100,000 Google Play reviews. On desktop it’s competent. Pro+ is $4.95/month annual with 5 free additional seats — materially cheaper than Canva Pro for small teams.
Pros
- Pro+ at $4.95/month annual includes 5 additional team seats — best value-per-seat on this list
- Mobile experience is best-in-class — 4.7/5 across 100,000 Google Play reviews, 4.6/5 on iOS
- Lockable brand templates (via We Brand sub-brand) genuinely enable franchise and multi-location marketing
- ChatGPT-powered text, AI image creator, AI logo generator on mobile
Cons
- Free tier limits PDF imports to 10 lifetime — restrictive if you regularly work from existing PDFs
- Real-time collaboration is thin compared to Canva and Adobe Express
- Print-fulfilment side has a meaningful Trustpilot tail of refund and order complaints (the SaaS itself rates well)
- AI surface is narrower than Canva Magic Studio — present, not headline-strong
Pricing
- Free: Limited features, 10 lifetime PDF imports
- Pro+: $4.95/month annual ($59.40/year) — 5 additional team seats included
- Business: $29.95/month for 6 users — drops per-seat as teams grow
- Enterprise / We Brand: Custom — locked templates, franchise brand controls
Fluer is the right pick for franchise networks, multi-location SMBs, and mobile-first teams who need brand-locked templates without enterprise pricing. It’s the wrong pick if real-time collaboration is a daily requirement or if you need broad AI coverage.
If your team is locked into Canva for collaboration features, stay there. If brand control across non-designer franchisees matters more than collab, Fluer (formerly Desygner) is the cheaper, sharper fit.
8. Pixelied — Best for solo creators and bloggers wanting a budget-tier design and mockup suite
Pixelied is a budget design suite leaning toward photo editing and product mockups. It’s not abandoned, but it’s slowed: blog last updated November 2021, footer dated 2024, support response times degrading per recent AppSumo reviews. Pricing is genuinely cheap — Pro at $47/year with no monthly option and no team plan. The strongest fit is as a low-cost mockup and graphics utility alongside your main design tool, especially for solo creators who don’t need ongoing feature releases.
Pros
- Pro at $47/year is genuinely cheap for a multi-feature design and mockup tool
- Mockup library is the standout feature — phone, laptop, tablet, t-shirt, billboard mockups built in
- Background remover, batch editing, and template library cover the basics for blog graphics and social posts
- Capterra 4.7/5 across 106 reviews suggests existing users are happy with what they have
Cons
- Soft maintenance mode: blog stale since November 2021, no public changelog, ads appearing inside paid accounts per recent AppSumo reviews
- Support response times degrading — multiple 2025 AppSumo 1-star reviews cite 3+ day waits
- No team plan — Pro+ at $79/year covers more features but still single-user
- Annual-only billing — no monthly option to test commitment
Pricing
- Free: Limited features, watermarked
- Pro: $47/year — annual only, single user
- Pro+: $79/year — annual only, more features, single user
Pixelied is the right pick for solo creators, bloggers, and affiliate marketers who want a cheap multi-feature design tool and don’t need active development or team features. It’s the wrong pick for anyone needing infographics, reports, data viz, or a tool you can commit to long-term.
9. Microsoft Designer — Best for Microsoft 365 and Copilot users who want free AI-first design baked into the Office stack
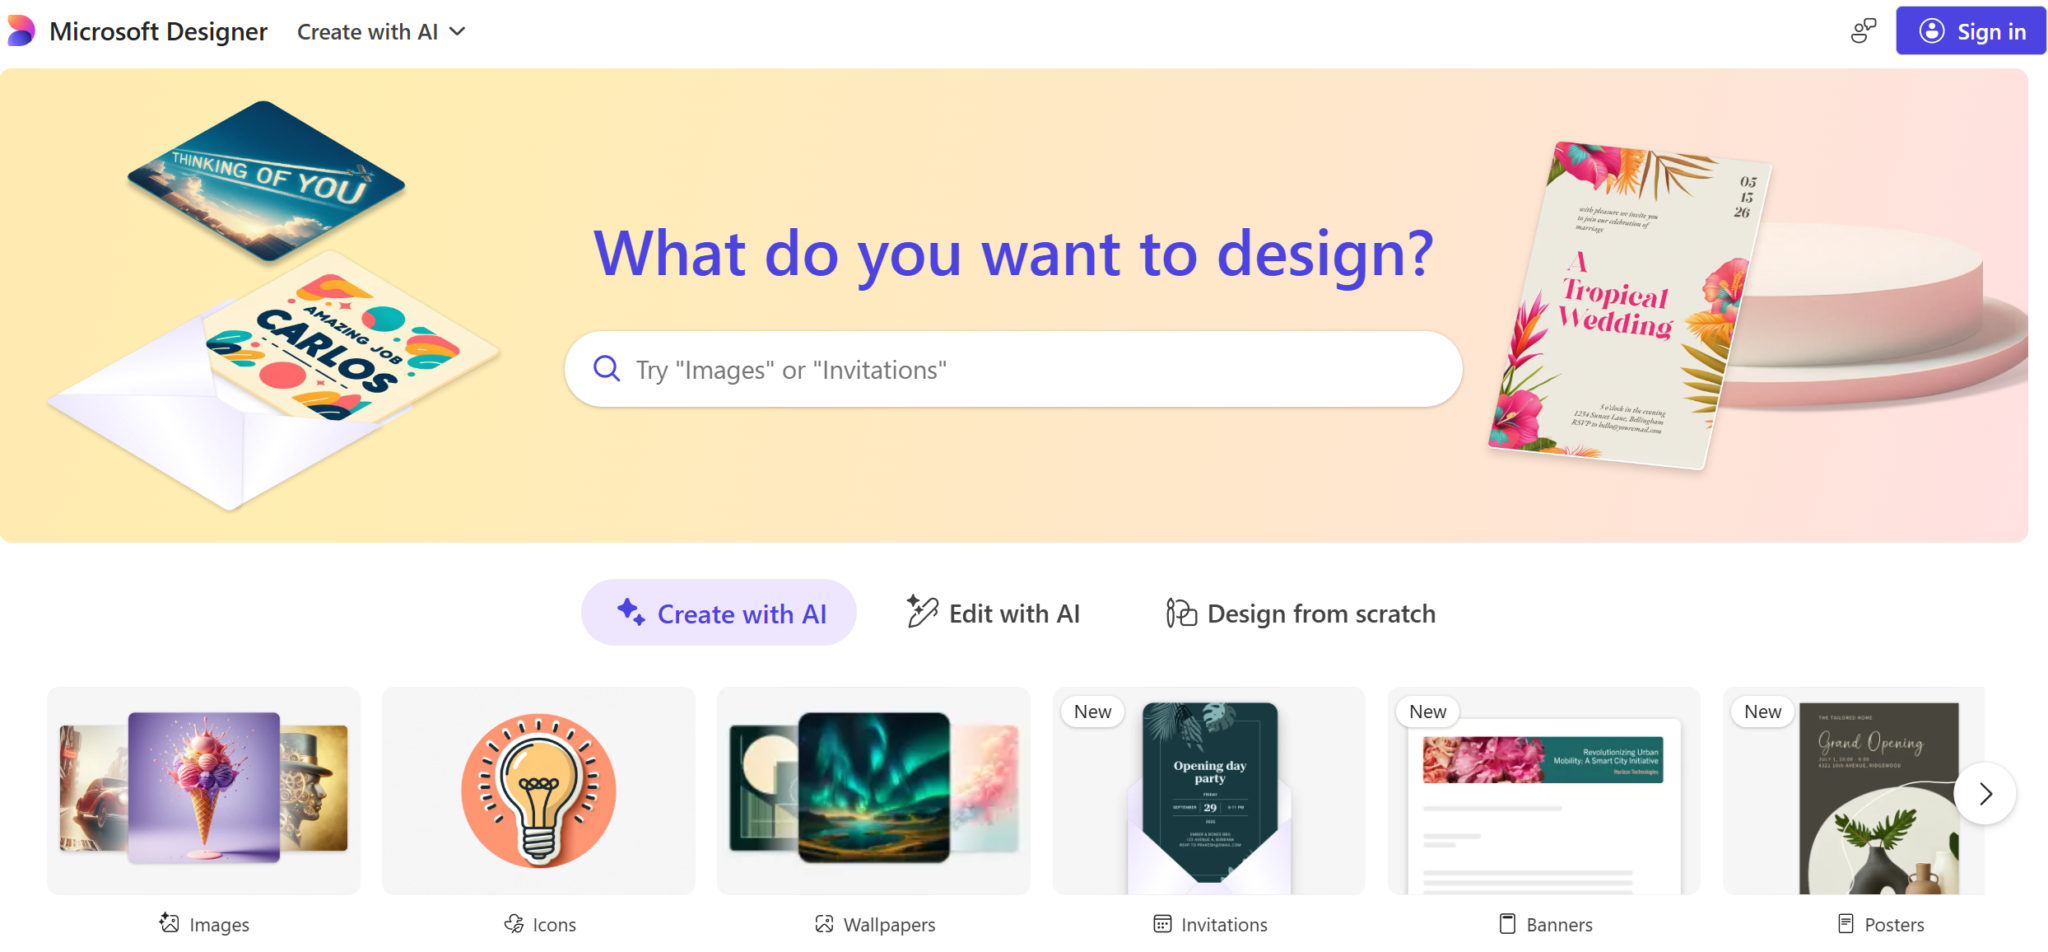
Microsoft Designer is Microsoft’s AI-first design app, now folded into the Microsoft 365 Copilot bundle. Type a prompt, get a near-final social post, invite, or graphic in seconds — powered by DALL·E and Copilot under the hood. For anyone already paying for Microsoft 365 or Copilot Pro, it’s effectively free design software with a generative-first workflow that Canva is still catching up to.
Pros
- Truly AI-first — prompt-to-design and “design from image” workflows are faster than Canva Magic Studio for one-off social and invitation graphics
- Free with any Microsoft 365 Personal/Family or Copilot Pro subscription — no extra seat cost for teams already on the Microsoft stack
- DALL·E image generation, Restyle Image, Edit with AI, and Frame Your Photo cover most generative needs without leaving the editor
- Tight integration with Word, PowerPoint, and Outlook — designs land directly inside the Office files you’re already shipping
Cons
- Free tier caps you at 15 AI generations per month (down from earlier limits) — heavy users will hit the wall fast
- Template library, fonts, and stock assets are narrower than Canva’s — strong for prompt-led work, lighter for hand-built designs
- Multi-page documents, infographics, and data viz aren’t the focus — single-canvas social, invite, and short-form graphics are where it shines
- Brand kit and team controls trail Canva Teams and Adobe Express Teams for organisations that need centralised brand governance
Pricing
- Free: 15 AI image generations/month, full editor, basic templates
- With Microsoft 365 Personal/Family: Included — expanded AI generations and premium content
- With Copilot Pro ($20/month): Priority generation, faster image creation, expanded credits
Microsoft Designer is the right pick for Microsoft 365 and Copilot subscribers, marketing and HR teams already living in PowerPoint and Outlook, and anyone who wants generative-first design with no extra subscription. It’s the wrong pick if you need infographics, multi-page reports, deep brand controls, or a tool that lives independently of the Microsoft ecosystem.
If you’re already paying for Microsoft 365, Designer is the cheapest Canva alternative on this list as it’s effectively included. If your work is infographics or reports rather than one-off social graphics, Piktochart is the better long-term fit.
10. PicMonkey — Best for users who need deep photo editing and don’t mind that the product is in maintenance mode
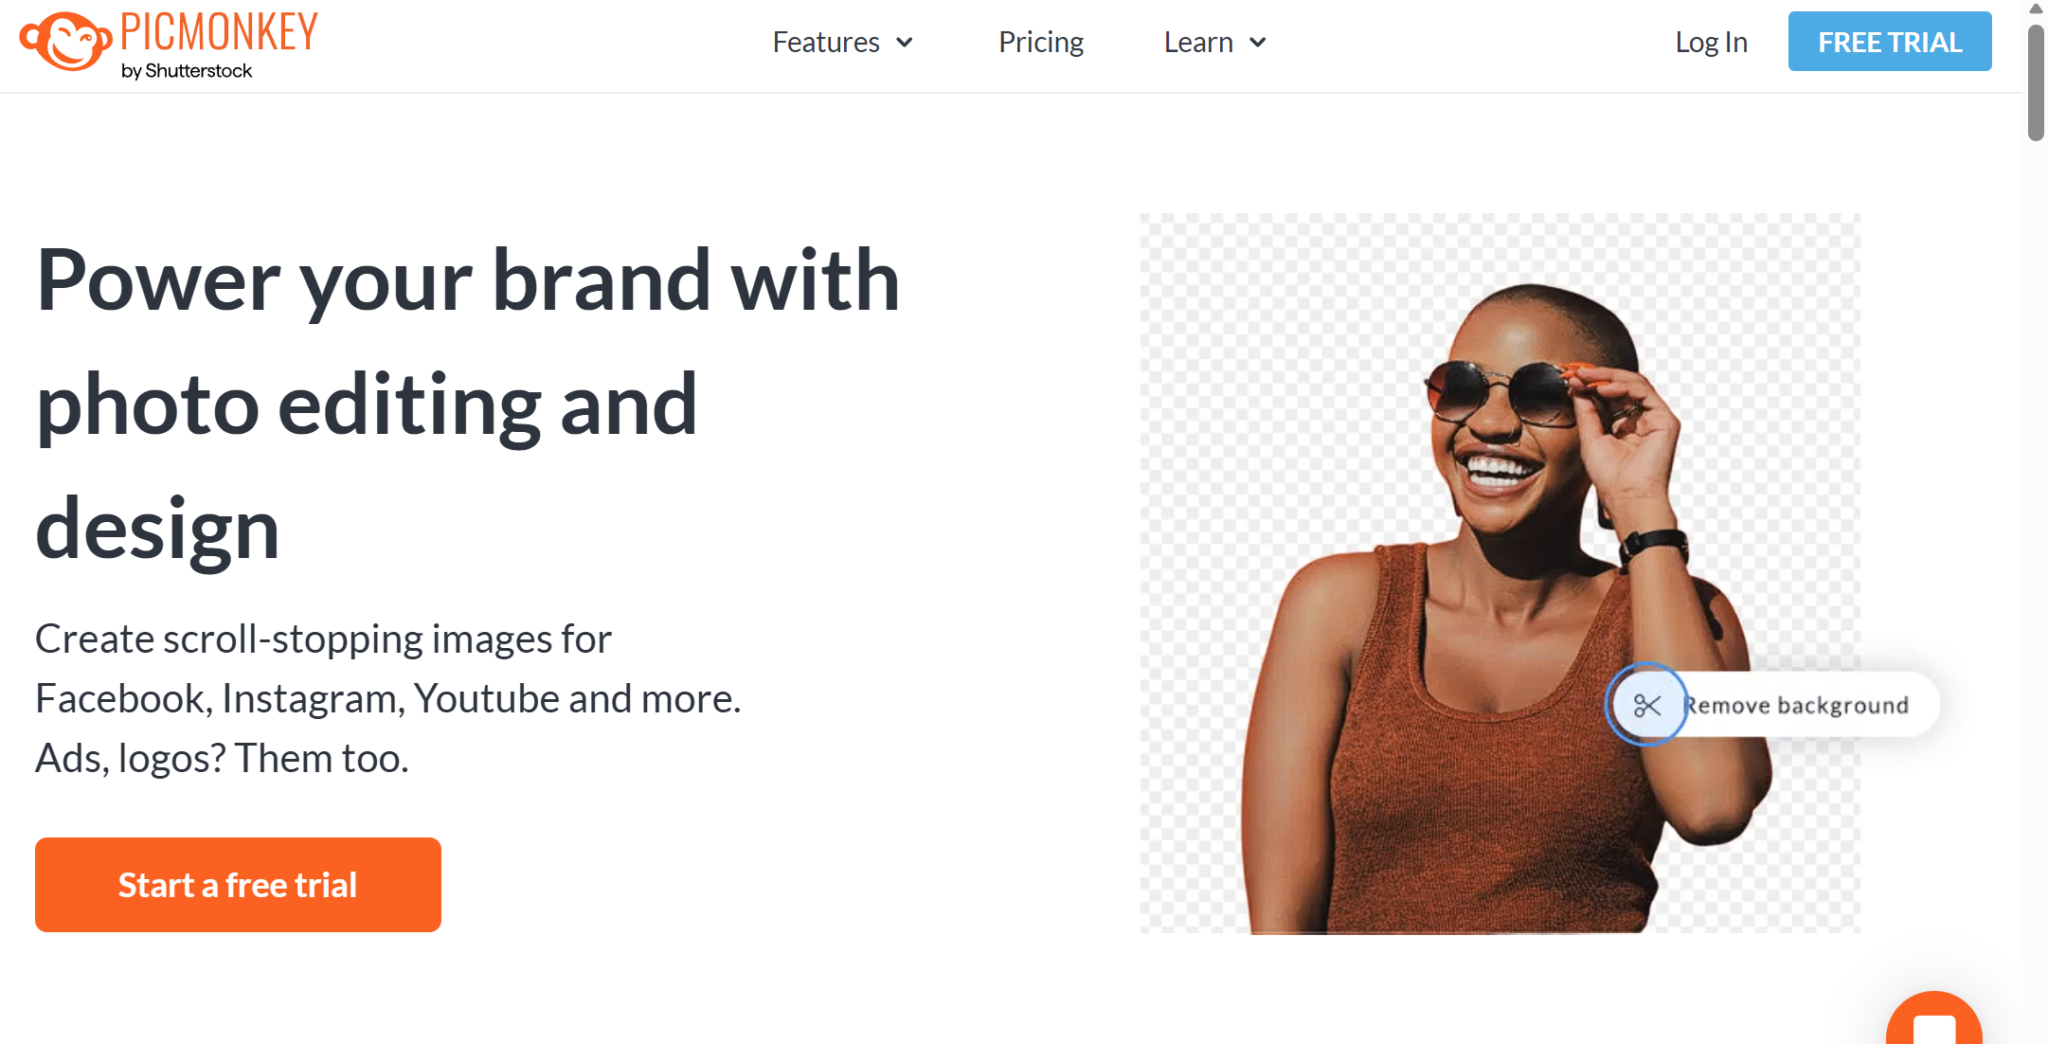
PicMonkey is a photo-editing-first tool acquired by Shutterstock in 2021. The product still works and the photo-editing depth (layered effects, Color Changer, Touch Up, curve text) is meaningfully better than Canva or Adobe Express’s photo tools. But: the public changelog is frozen at 2021, and PicMonkey’s own help docs say small bugs are unlikely to be fixed. It still earns its place if you specifically need its photo-editing depth in the next 12–18 months — just go in knowing the roadmap is paused.
Pros
- Photo editing depth — layered effects, Color Changer, Touch Up, curve text — genuinely better than Canva or Adobe Express’s photo tools
- Pro tier ($12.99/month) includes a 1M-photo curated Shutterstock library
- 7-day free trial covers basic export and feature exploration
- Capterra 4.5/5 from 1,141 reviews — established, positive user base
Cons
- PicMonkey’s own help docs acknowledge maintenance mode: “small problems or bugs are unlikely to be fixed at this time”
- Public changelog frozen since October 2021 — nearly 5 years of public silence
- Trial billing is aggressive — billed without warning at trial end is the dominant complaint pattern
- No real AI strategy — Shutterstock has its own AI image generator that hasn’t been integrated into PicMonkey
Pricing
- Free trial: 7 days
- Basic: $7.99/month or $72/year
- Pro: $12.99/month or $120/year — Shutterstock library, full feature set
- Business: $23/month or $228/year — team and brand features
PicMonkey is the right pick if you need photo editing depth specifically and your needs are stable for the next 12-18 months. It’s the wrong pick if you want active product development, AI features, or a long-term toolchain.
Why Look for Canva Alternatives in 2026?
Canva is still a capable design tool. No debate there. But over the past year, a growing number of users have started shopping around — and for good reason.
The pricing is the most cited complaint. A team of five users that used to pay ~$26/month now pays ~$45/month. Canva’s justification is the rollout of AI features across its platform. The problem: most teams don’t use most of them.
Beyond pricing, there are genuine feature limitations worth knowing about. Searching for free assets without accidentally landing on premium ones is a persistent frustration. Charts and maps remain limited compared to dedicated data visualization tools. And downloading a design only to find it looks different outside the canvas is a small issue with a disproportionate impact on professional work.
Then there’s the question of fit. Canva is built as a general-purpose tool. If your work is presentation-heavy, infographic-heavy, or requires real-time team collaboration with approval workflows, you may find it stretches to cover your needs rather than being built for them.
The alternatives listed above aren’t Canva clones. Each one has a specific strength. The goal of this list is to help you find the one that matches how you actually work — not how Canva assumes you do.
Wrapping up on the best Canva alternatives
While Canva is still a popular choice, these 10 Canva alternatives demonstrate there are many excellent options for graphic design needs. Whether you’re creating social media graphics or comprehensive marketing materials, these tools can produce visually appealing content without requiring extensive training.
The best Canva alternatives for graphic design professionals might differ from the best choices for casual users. Consider your specific needs, from collaboration features to video editing capabilities, when choosing the right Canva alternative that offers what you need.
Creating visual content is mandatory. But using only Canva and Adobe products isn’t your only option. Luckily, you have plenty of platforms like the ones mentioned above to pick from, each with as many options as Canva but with their own unique strengths. Happy hunting!