 Piktochart Team
·

Updated on
September 4, 2024
Published on
August 1, 2024

A top-notch Fishbone Diagram can make a significant impact on your problem-solving and decision-making processes by helping you identify root causes and potential solutions. Utilizing Fishbone Diagram templates, like those available on Piktochart, can streamline the process and help you create a professional and effective diagram.
Before diving into creating your own Fishbone Diagrams, it's essential to explore some of the best examples for inspiration. Unfortunately, we cannot provide a link to the 20 best examples of Fishbone Diagrams, but we encourage you to search for them online to get a better understanding of how to create an impactful diagram.
A Fishbone Diagram, also known as an Ishikawa Diagram or Cause and Effect Diagram, is a visual tool used to identify and analyze the root causes of a problem or issue. It helps in organizing and categorizing potential causes, making it easier to identify the primary factors contributing to the problem. Fishbone Diagrams are particularly useful in situations where a team needs to identify the root causes of a complex problem, such as in manufacturing processes, project management, and quality improvement initiatives.
Here are the top 20 Fishbone Diagram examples:

The Pink Fishbone Diagram Design example presents a visually engaging and modern layout that is both aesthetically pleasing and easy to comprehend. The design's color scheme and structure make it stand out, ensuring that your Fishbone Diagram will capture the attention of your audience.

The Simple Boho Fishbone Diagram for Inflation example features a clean and minimalist design that is both visually appealing and easy to read. The layout is optimized for presenting complex information related to inflation in a clear and concise manner.
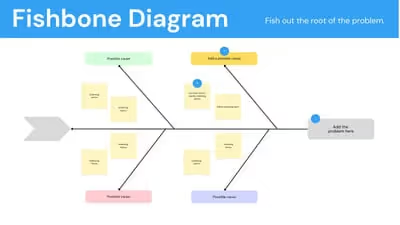
The Blue & Yellow Fishbone Diagram on Whiteboard example showcases a clean and modern design that is both visually appealing and easy to read. The layout is optimized for presenting complex information in a clear and concise manner on a whiteboard setting.

The Simple Modern Beige & Brown Fishbone Diagram example showcases a clean and contemporary design that is both visually appealing and easy to read. The layout is optimized for presenting complex information in a clear and concise manner.

The Fishbone Diagram for Problem Solving example showcases a clean and modern design that is both visually appealing and easy to read. The layout is optimized for presenting complex information related to problem-solving in a clear and concise manner.

The Clean Fishbone Diagram for Problem-Solution Method example showcases a clean and modern design that is both visually appealing and easy to read. The layout is optimized for presenting complex information related to problem-solving in a clear and concise manner.

The Fishbone Diagram Whiteboard Template example showcases a clean and modern design that is both visually appealing and easy to read. The layout is optimized for use on whiteboards, making it an ideal choice for collaborative brainstorming sessions and team problem-solving exercises.

The Cream Pastel Minimalist Fishbone Diagram Graph example showcases a clean and modern design that is both visually appealing and easy to read. The layout is optimized for presenting complex information in a clear and concise manner, with a focus on a minimalist aesthetic.

The Fishbone Diagram Infographic for Production Process example showcases a clean and modern design that is both visually appealing and easy to read. The layout is optimized for presenting complex information related to production processes in a clear and concise manner.

The Red Navy Fishbone Diagram Chart example showcases a clean and modern design that is both visually appealing and easy to read. The layout is optimized for presenting complex information in a clear and concise manner, with a focus on a striking red and navy color scheme.

The Basic Fishbone Diagram Brainstorm in Black, White, Blue & Yellow example showcases a clean and modern design that is both visually appealing and easy to read. The layout is optimized for brainstorming sessions, making it an ideal choice for individuals and teams looking to identify root causes and potential solutions in a clear and concise manner.

The Neutral Business Fishbone Diagram Design example showcases a clean and modern design that is both visually appealing and easy to read. The layout is optimized for presenting complex information in a clear and concise manner, with a focus on a neutral color scheme suitable for various business settings.

The Neutral Fishbone Diagram Design example showcases a clean and modern design that is both visually appealing and easy to read. The layout is optimized for presenting complex information in a clear and concise manner, with a focus on a neutral color scheme suitable for various settings and preferences.

The Blue Minimalist Fishbone Infographic Graph example showcases a clean and modern design that is both visually appealing and easy to read. The layout is optimized for presenting complex information in a clear and concise manner, with a focus on a minimalist aesthetic and a calming blue color scheme.

The Minimalist Nude Sales Automation Fishbone example showcases a clean and modern design that is both visually appealing and easy to read. The layout is optimized for presenting complex information related to sales automation in a clear and concise manner.

The Minimalist White Fishbone Diagram Graph example showcases a clean and modern design that is both visually appealing and easy to read. The layout is optimized for presenting complex information in a clear and concise manner, with a focus on a minimalist white color scheme.

The Simple Brown Abstract Fishbone Design example showcases a clean and modern design that is both visually appealing and easy to read. The layout is optimized for presenting complex information in a clear and concise manner, with a focus on an abstract brown color scheme.

The Basic Fishbone Diagram Whiteboard Brainstorm in Black, White, Blue & Red example showcases a clean and modern design that is both visually appealing and easy to read. The layout is optimized for whiteboard brainstorming sessions, making it an ideal choice for individuals and teams looking to identify root causes and potential solutions in a clear and concise manner.

The Abstract Fishbone Diagram Infographic example showcases a clean and modern design that is both visually appealing and easy to read. The layout is optimized for presenting complex information in a clear and concise manner, with a focus on an abstract and artistic aesthetic.

The Factors of a Good Website Design Fishbone Diagram example showcases a clean and modern design that is both visually appealing and easy to read. The layout is optimized for presenting complex information related to the essential elements of effective website design in a clear and concise manner.
If you need help generating Fishbone Diagrams, look no further than Piktochart. Piktochart is an online platform trusted by millions, offering a wide range of templates and tools to help you create professional-looking visuals, including infographics, presentations, posters, and more, without any design experience. With its user-friendly and engaging interface, you'll be able to create stunning Fishbone Diagrams with ease. To get started, simply sign up for Piktochart and begin exploring the possibilities.
In conclusion, Fishbone Diagrams are valuable tools for identifying and analyzing the root causes of complex problems. By utilizing a platform like Piktochart, you can create visually engaging and professional-looking diagrams that effectively communicate the potential causes and solutions to your team and stakeholders. With its user-friendly interface and extensive template library, Piktochart makes it easy for anyone to create stunning Fishbone Diagrams, regardless of their design experience. So, why wait? Sign up for Piktochart today and start creating impactful Fishbone Diagrams that will enhance your problem-solving and decision-making processes.
The latest industry news, interviews, technologies, and resources.

Published on
November 25, 2024


