Online diagram maker to create stunning diagrams
Make professional diagrams for free with no design experience. Use Piktochart’s free online diagram maker and diagram templates to build a custom diagram in minutes, right in your browser.

Piktochart’s diagram maker is chosen by professionals and educators worldwide.


Easy-to-use diagram maker
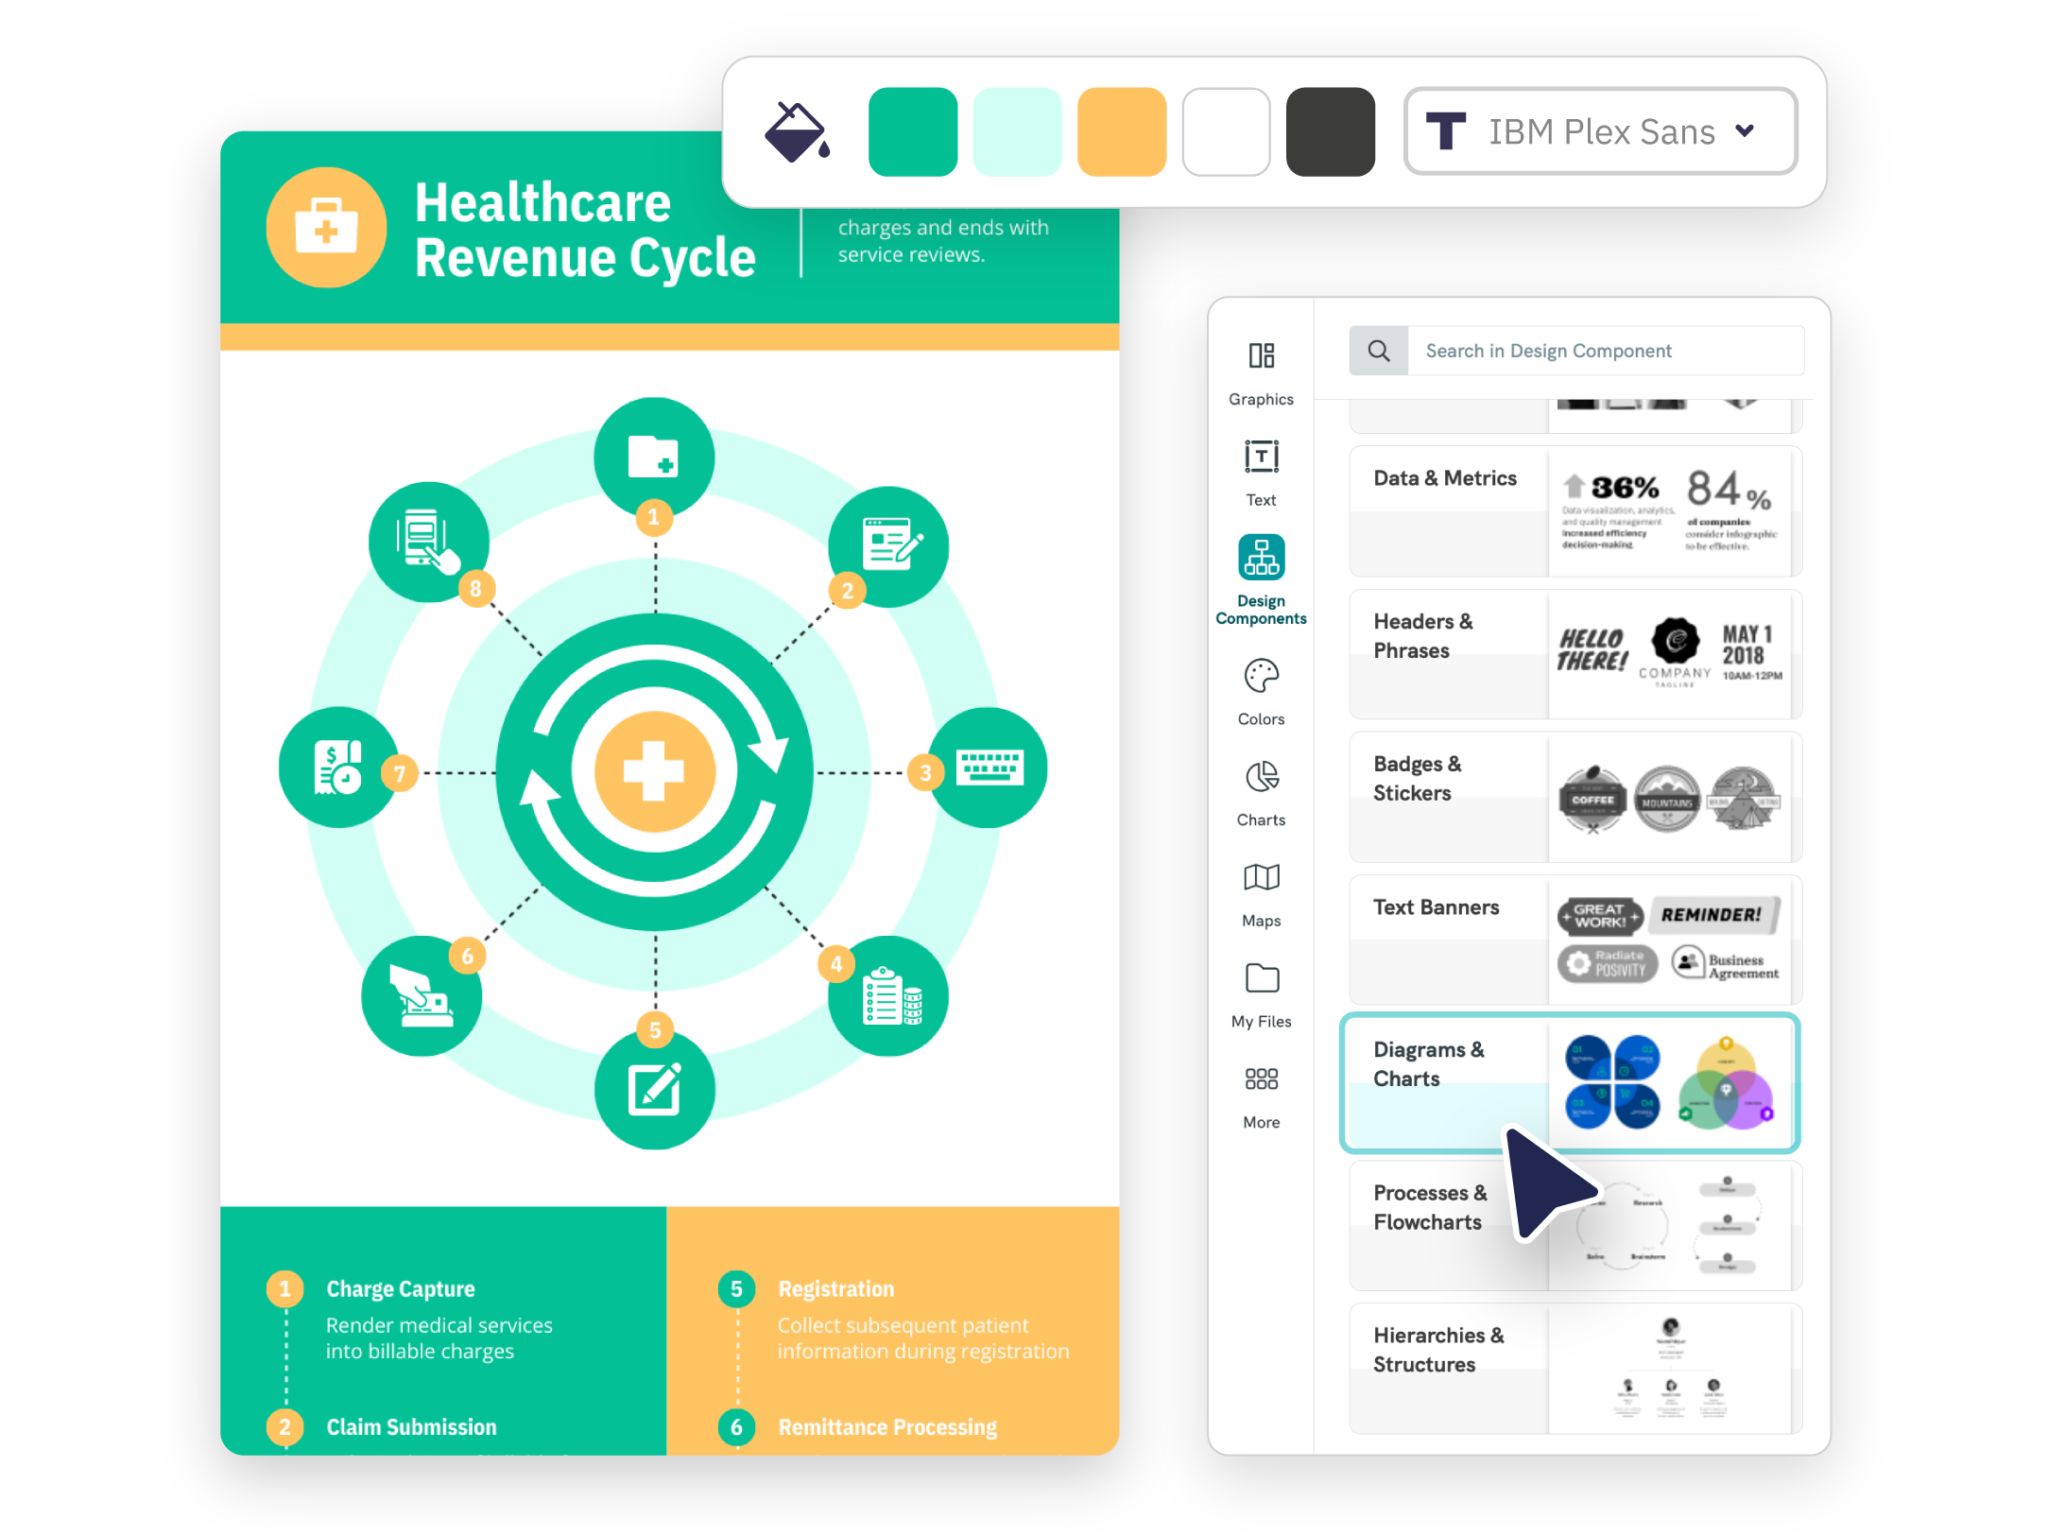
Create Diagrams Online
Diagrams are a powerful tool for visual communication and can be used in a wide range of contexts to enhance understanding, clarify information, and convey complex ideas.
With Piktochart, you can easily make a custom diagram, chart, graph, and more.
What else? With our online diagram maker, collaboration and real-time customer support are included for all account types; both the free and paid professional plans.


Free pre-made diagram templates
Choose From a Vast Library of Professionally Designed Diagram Templates
Our Piktochart design team ensures that the diagram templates you find on our online diagram maker are based on proper research and accurate data and follow the latest communication design trends.
From network diagrams, UML diagrams and ER diagrams to Venn diagrams, Piktochart offers professional diagram templates that help you save time and allow you to become a pro diagram creator with our varied diagram types.

Turn Complex Information Into an Easily Digestible Diagram Design
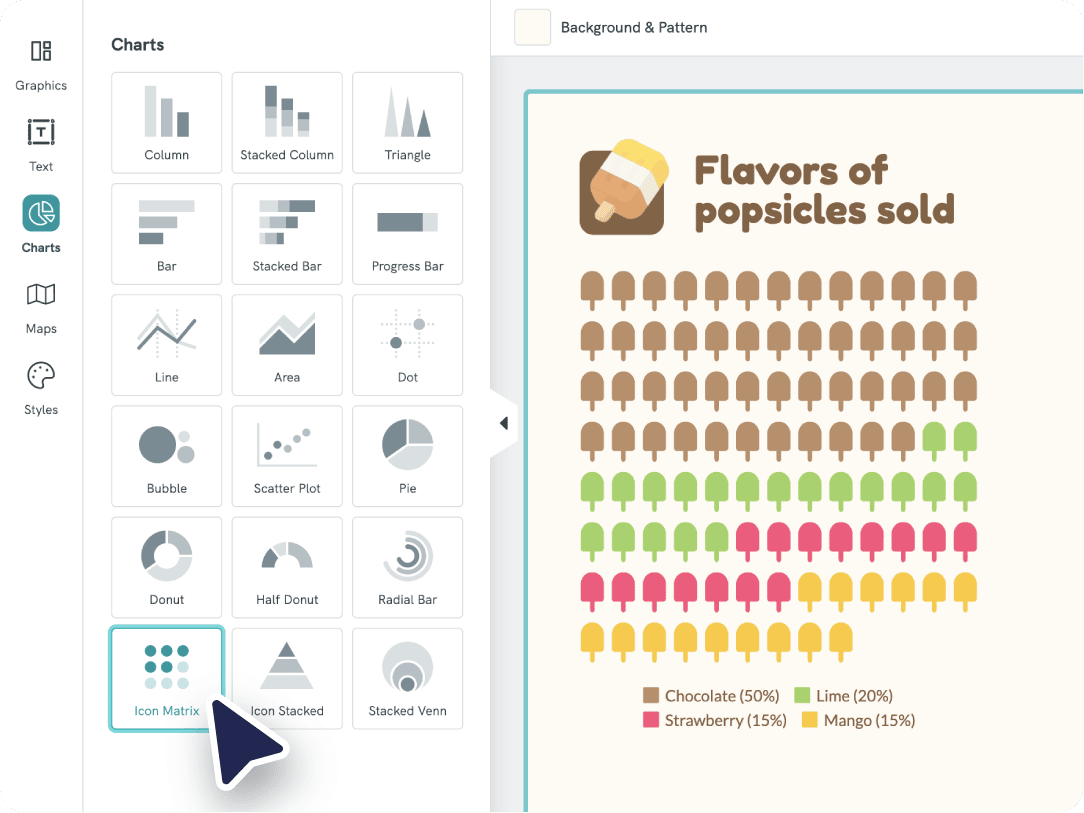
Turn intricate data into clear data visualization with your own diagram. Choose between charts, graphs, and interactive maps to present your data clearly and understandably. Showcase a timeline, list, process, or data comparison.
The free diagram maker from Piktochart grants you access to all types of charts: pie charts, bar charts, pictographs, and more to create visuals for all your needs.


Branded diagramming with your own content
Customize Diagrams for Your Brand in Seconds
With Piktochart’s brand assets feature, your content is always on-brand. Using our free diagram maker, find new solutions to classic customization problems with our unique features.
Upgrade your free plan, and in three clicks you can make beautiful visuals with your own images, graphs, elements, shapes, marketing materials, ideas, and more.
“I was looking at different companies, like Canva and Venngage and whatnot, and what really interested me about Piktochart was that they had just as many features, but I felt the price was just right in a sense; we were able to get more for our money, for less than the competitors.”

Theodore Paat
Instructional Designer at Affirm
How to Create a Diagram
1. Log into your Piktochart account
Log into Piktochart (or sign up for the Free plan if you don’t have one already) and go to the dashboard. Once you’re there, go to the sidebar to the left and click diagrams.
2. Pick a diagram template
Our high-quality diagramming templates save you time and make your visuals and presentations look as professional as possible. There is a variety of types of diagrams to choose from. You also have the option to start from a blank canvas if you prefer it.
3. Customize the diagram
Once you pick a diagram template, modify the colors, adapt the fonts, insert your own text, and even add your company colors to make your visual content fit your organization or brand. Ask for feedback and connect with different teams or other collaborators effortlessly.
4. Add images, icons, and other assets to the diagram creator
Make engaging visuals by adding images, icons, illustrations, and gifs with the drag-and-drop editor. When working on reports, you can add a map and link your Excel file or Google Sheet from Google Docs.
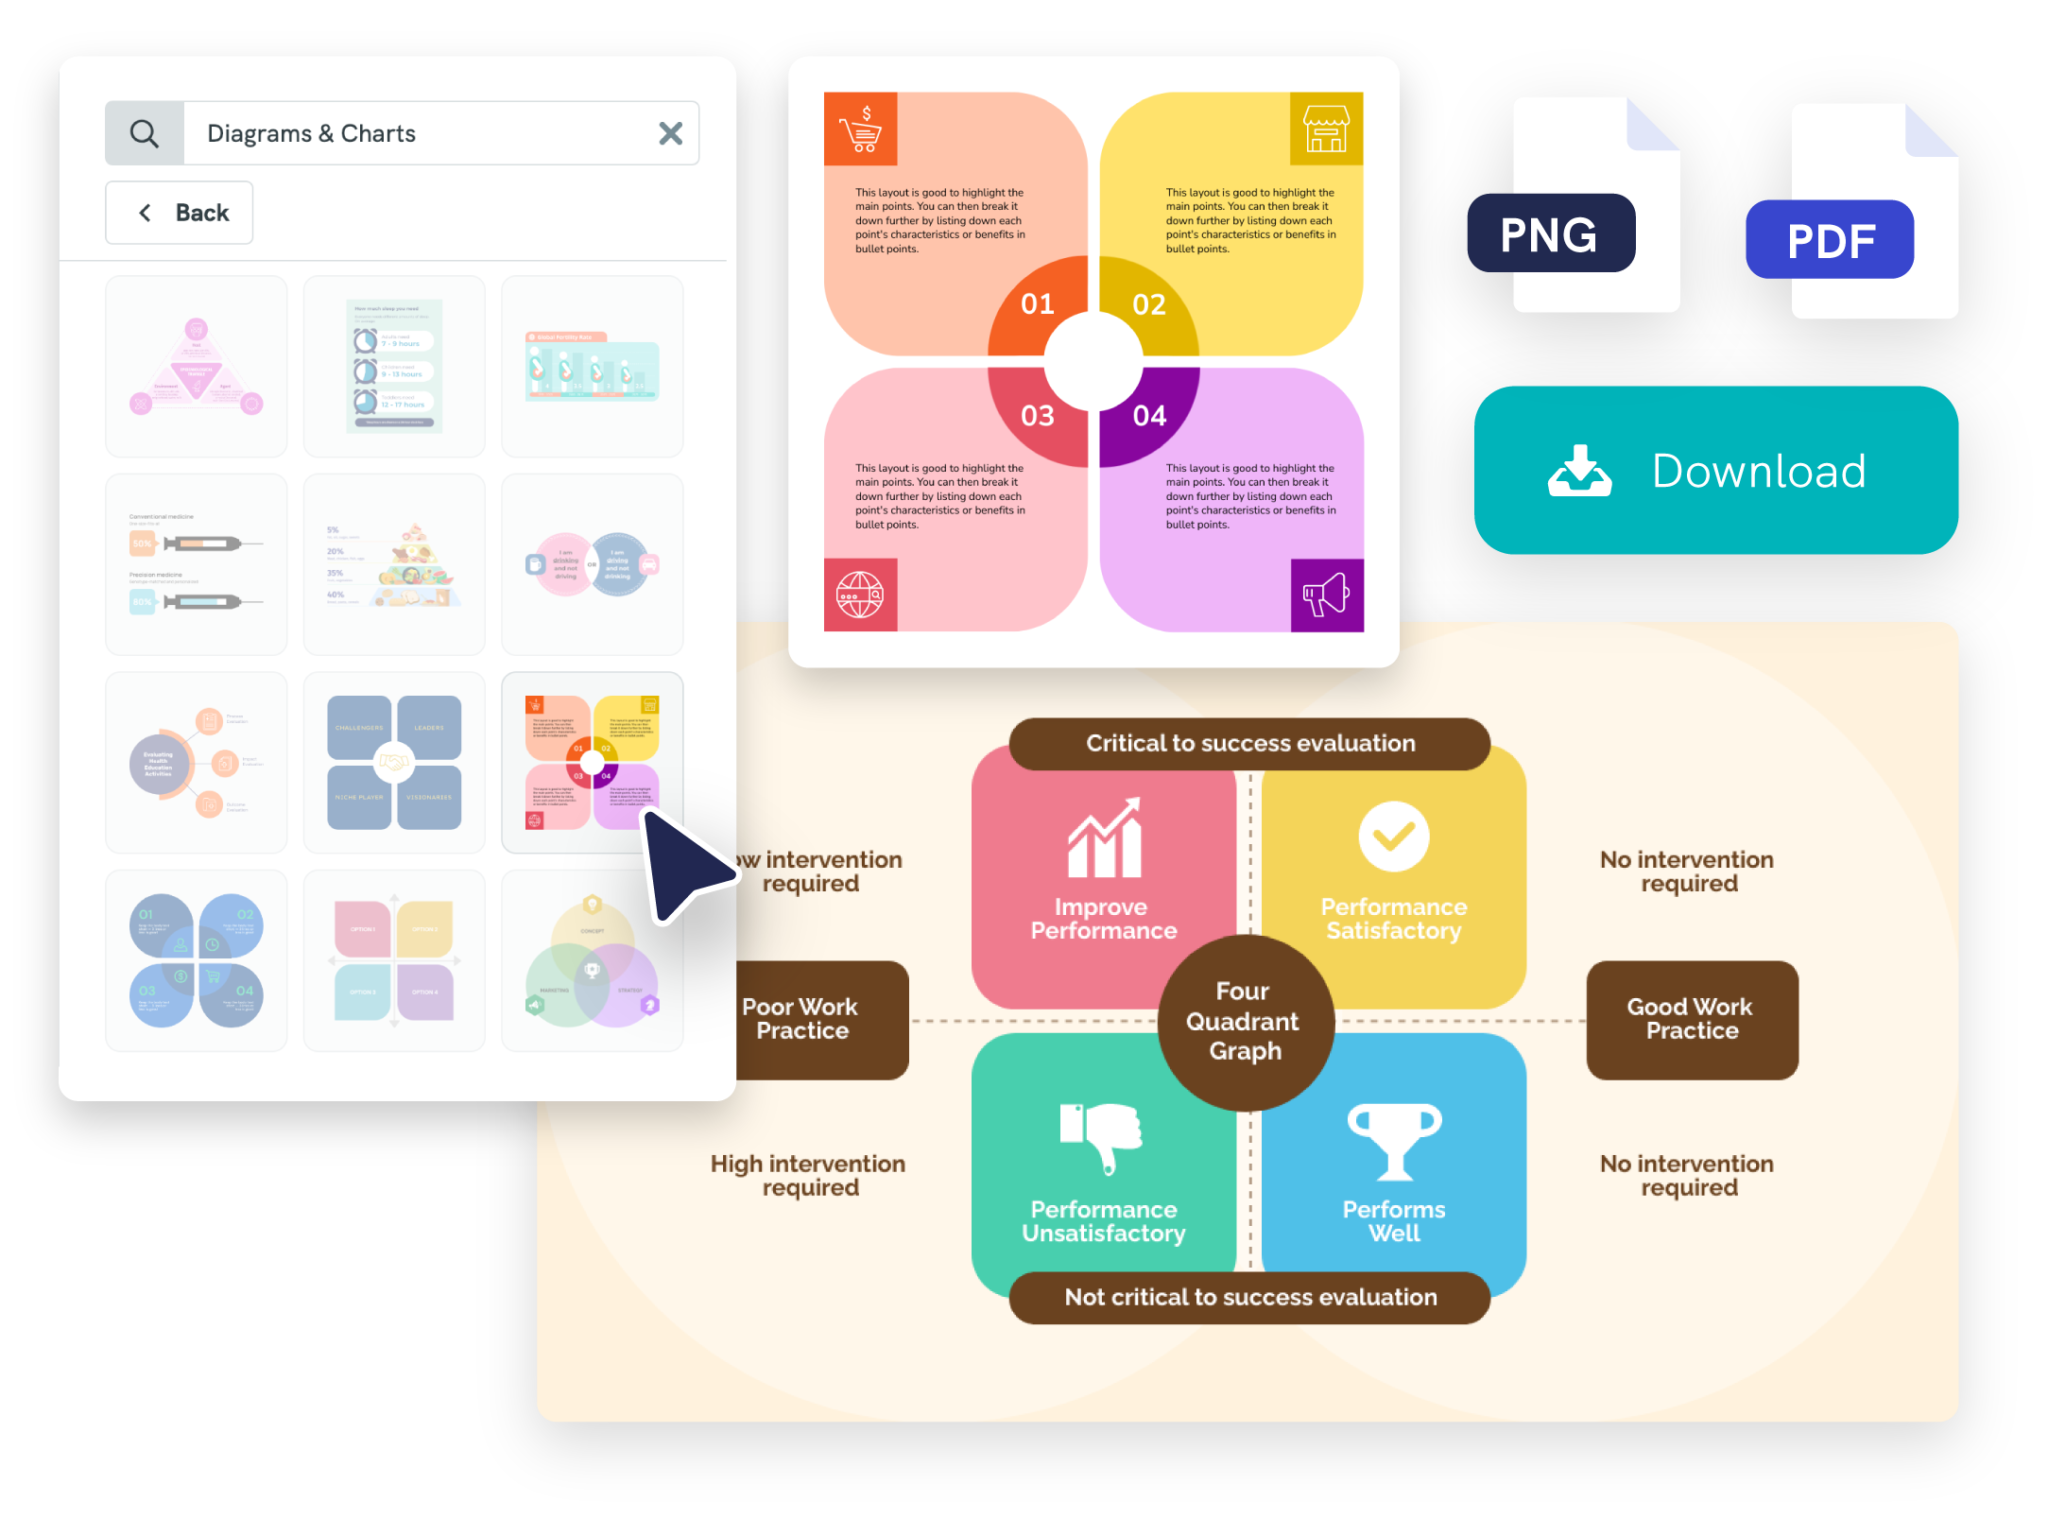
5. Download and share
Once you’re done visualizing data and customizing your visual, download it as a JPG, PNG (with the free account), or PDF (with the paid plans). You can also iterate and collaborate on the asset with your organization or team directly in Piktochart.
Edit One of Our Examples to Create a Diagram


Free diagram templates are available for all categories
Understanding the Different Types of Diagrams
Here are some of the primary types:
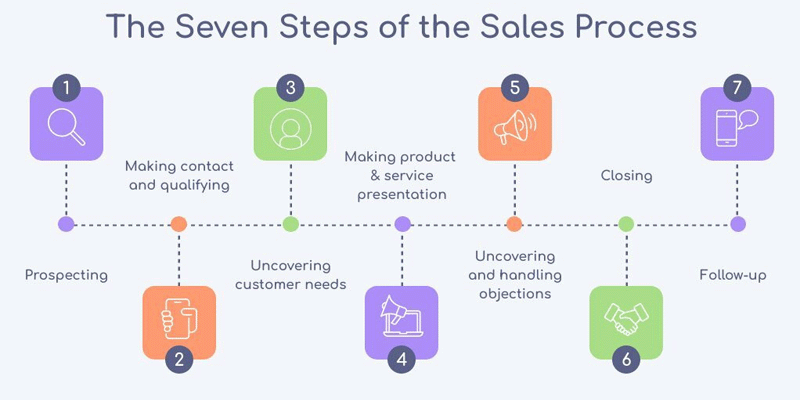
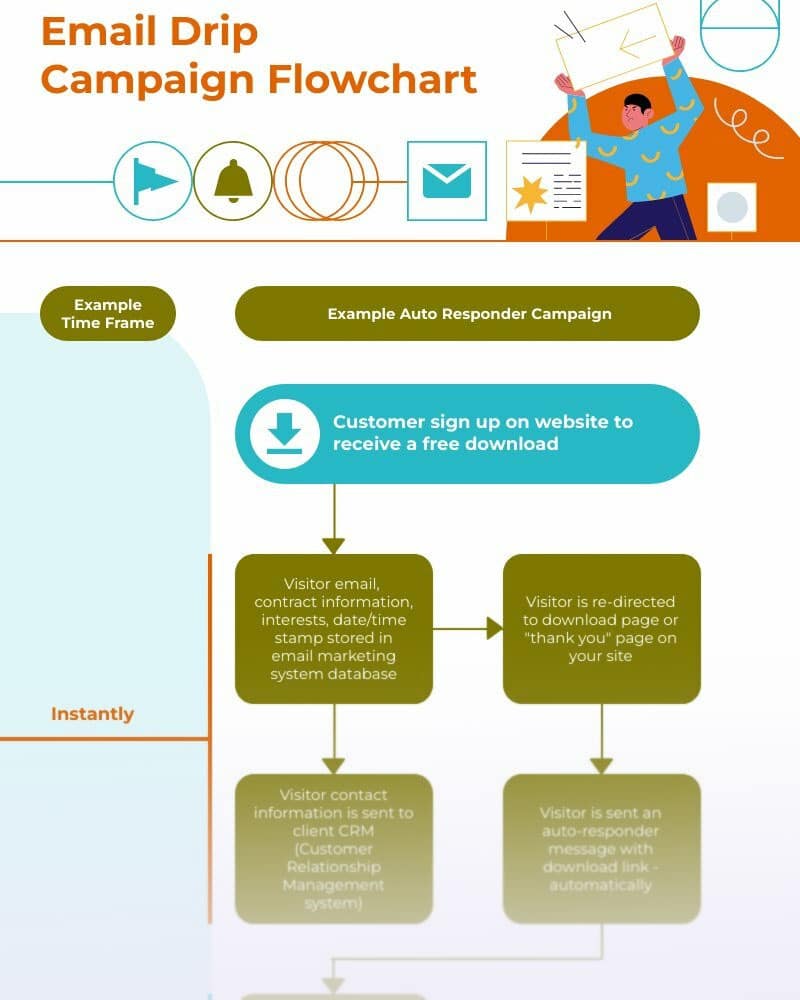
Flowcharts
Flowchart diagrams use various symbols and arrows to show the steps in a process or system.
Quadrant Diagrams
Quadrant graphs are commonly used in business and finance to analyze data and make strategic decisions.
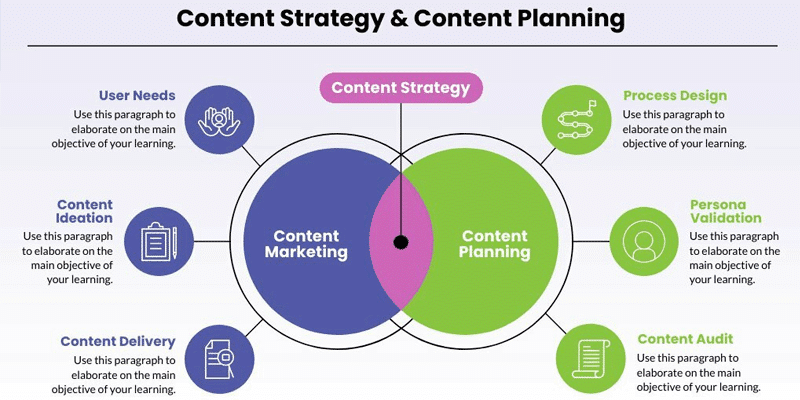
Venn Diagrams
Venn diagrams use overlapping circles or other shapes to show the relationships between data sets.
Bar Charts
These graphs use horizontal or vertical bars to show data visually.
Pie Charts
These diagrams use a circular shape and different-sized slices to represent the proportions or percentages of a whole.
Network Diagrams
These visuals show the relationships between different elements in a network or system.
Scatter Plots
These plots use points on a graph to show the relationship between two variables.
UML Diagrams
These visuals are used in software engineering to show the structure and behavior of software systems.
Ready to create beautiful diagrams?
Join more than 14 million people who already design information with Piktochart’s free online diagram maker.
Diagram FAQs
You only need to sign up for an account online with a cloud-based free diagram maker like Piktochart, Canva, or Venngage.
- Determine the purpose. Using a mind map can help.
- Keep it simple.
- Use consistent formatting.
- Label elements clearly.
- Use appropriate scaling.
- Review and revise.
Following these best practices, you can create and export diagrams effectively communicating complex information.
Additionally, many online diagramming tools offer training materials, tutorials, and resources.
{
“@context”: “https://schema.org”,
“@type”: “FAQPage”,
“mainEntity”: [
{
“@type”: “Question”,
“name”: “What is a diagram?”,
“acceptedAnswer”: {
“@type”: “Answer”,
“text”: “A diagram is a simplified and structured visual representation used to illustrate complex information, ideas, or processes in a manner that is easy to understand and interpret. Diagrams are utilized in various fields such as education, engineering, business, and science to clarify relationships, enhance comprehension of concepts, and aid in problem-solving. They come in different forms, including flowcharts, graphs, organizational charts, network diagrams, and schematic drawings, each tailored to convey specific types of information effectively. The use of symbols, lines, shapes, and text in diagrams helps to break down and organize information, making it more accessible.”
}
}, {
“@type”: “Question”,
“name”: “Where can I start creating diagrams for free?”,
“acceptedAnswer”: {
“@type”: “Answer”,
“text”: “You can make a diagram online or on your desktop, depending on your chosen tool. With desktop-based design software like Adobe Illustrator, you must install it and pay for the license. You only need to sign up for an account online with a cloud-based free diagram maker like Piktochart, Canva, or Venngage.”
}
}, {
“@type”: “Question”,
“name”: “What are some best practices to create diagrams?”,
“acceptedAnswer”: {
“@type”: “Answer”,
“text”: “Here are some best practices for creating them:Determine the purpose. Using a mind map can help.Keep it simple.Use consistent formatting.Label elements clearly.Use appropriate scaling.Review and revise.Following these best practices, you can create and export diagrams effectively communicating complex information.”
}
}, {
“@type”: “Question”,
“name”: “Do I need to download Piktochart for diagramming?”,
“acceptedAnswer”: {
“@type”: “Answer”,
“text”: “No, you don’t need to download Piktochart. The platform is cloud-based and hence lives online. Just sign up for a free account, and you can create visuals and content immediately.”
}
}, {
“@type”: “Question”,
“name”: “I don’t have any design experience. Can I really create different diagram types online?”,
“acceptedAnswer”: {
“@type”: “Answer”,
“text”: “Yes, you can create different diagram types online even if you have not gained any design experience. Many online tools, including Piktochart, offer templates, examples, concepts, shapes, and icons that make it easy to create professional-looking diagrams. Additionally, many online diagramming tools offer training materials, tutorials, and resources.”
}
} ]
}
Diagram Resources