“Piktochart AI is the easiest and fastest way to create visually appealing infographics!”
Aurelius Tjin
YouTuber and Digital Creator
The new way of creating infographics

Make it quick
Design beautiful infographics in seconds
No more tedious design processes—just enter a topic, and in a click of a button watch Pikto AI turn your text into visuals. Start with our AI-generated template, refine your message, and watch your vision unfold.
Generative AI is a type of machine learning that transforms simple inputs into detailed, creative outputs, learning from data to produce original, visually engaging material. Its ability to produce diverse and creative outcomes from simple inputs makes it simple to visualize data, whether you’re creating social media graphics, posters, or banners.

Make it seamless
Text-heavy content to engaging infographics
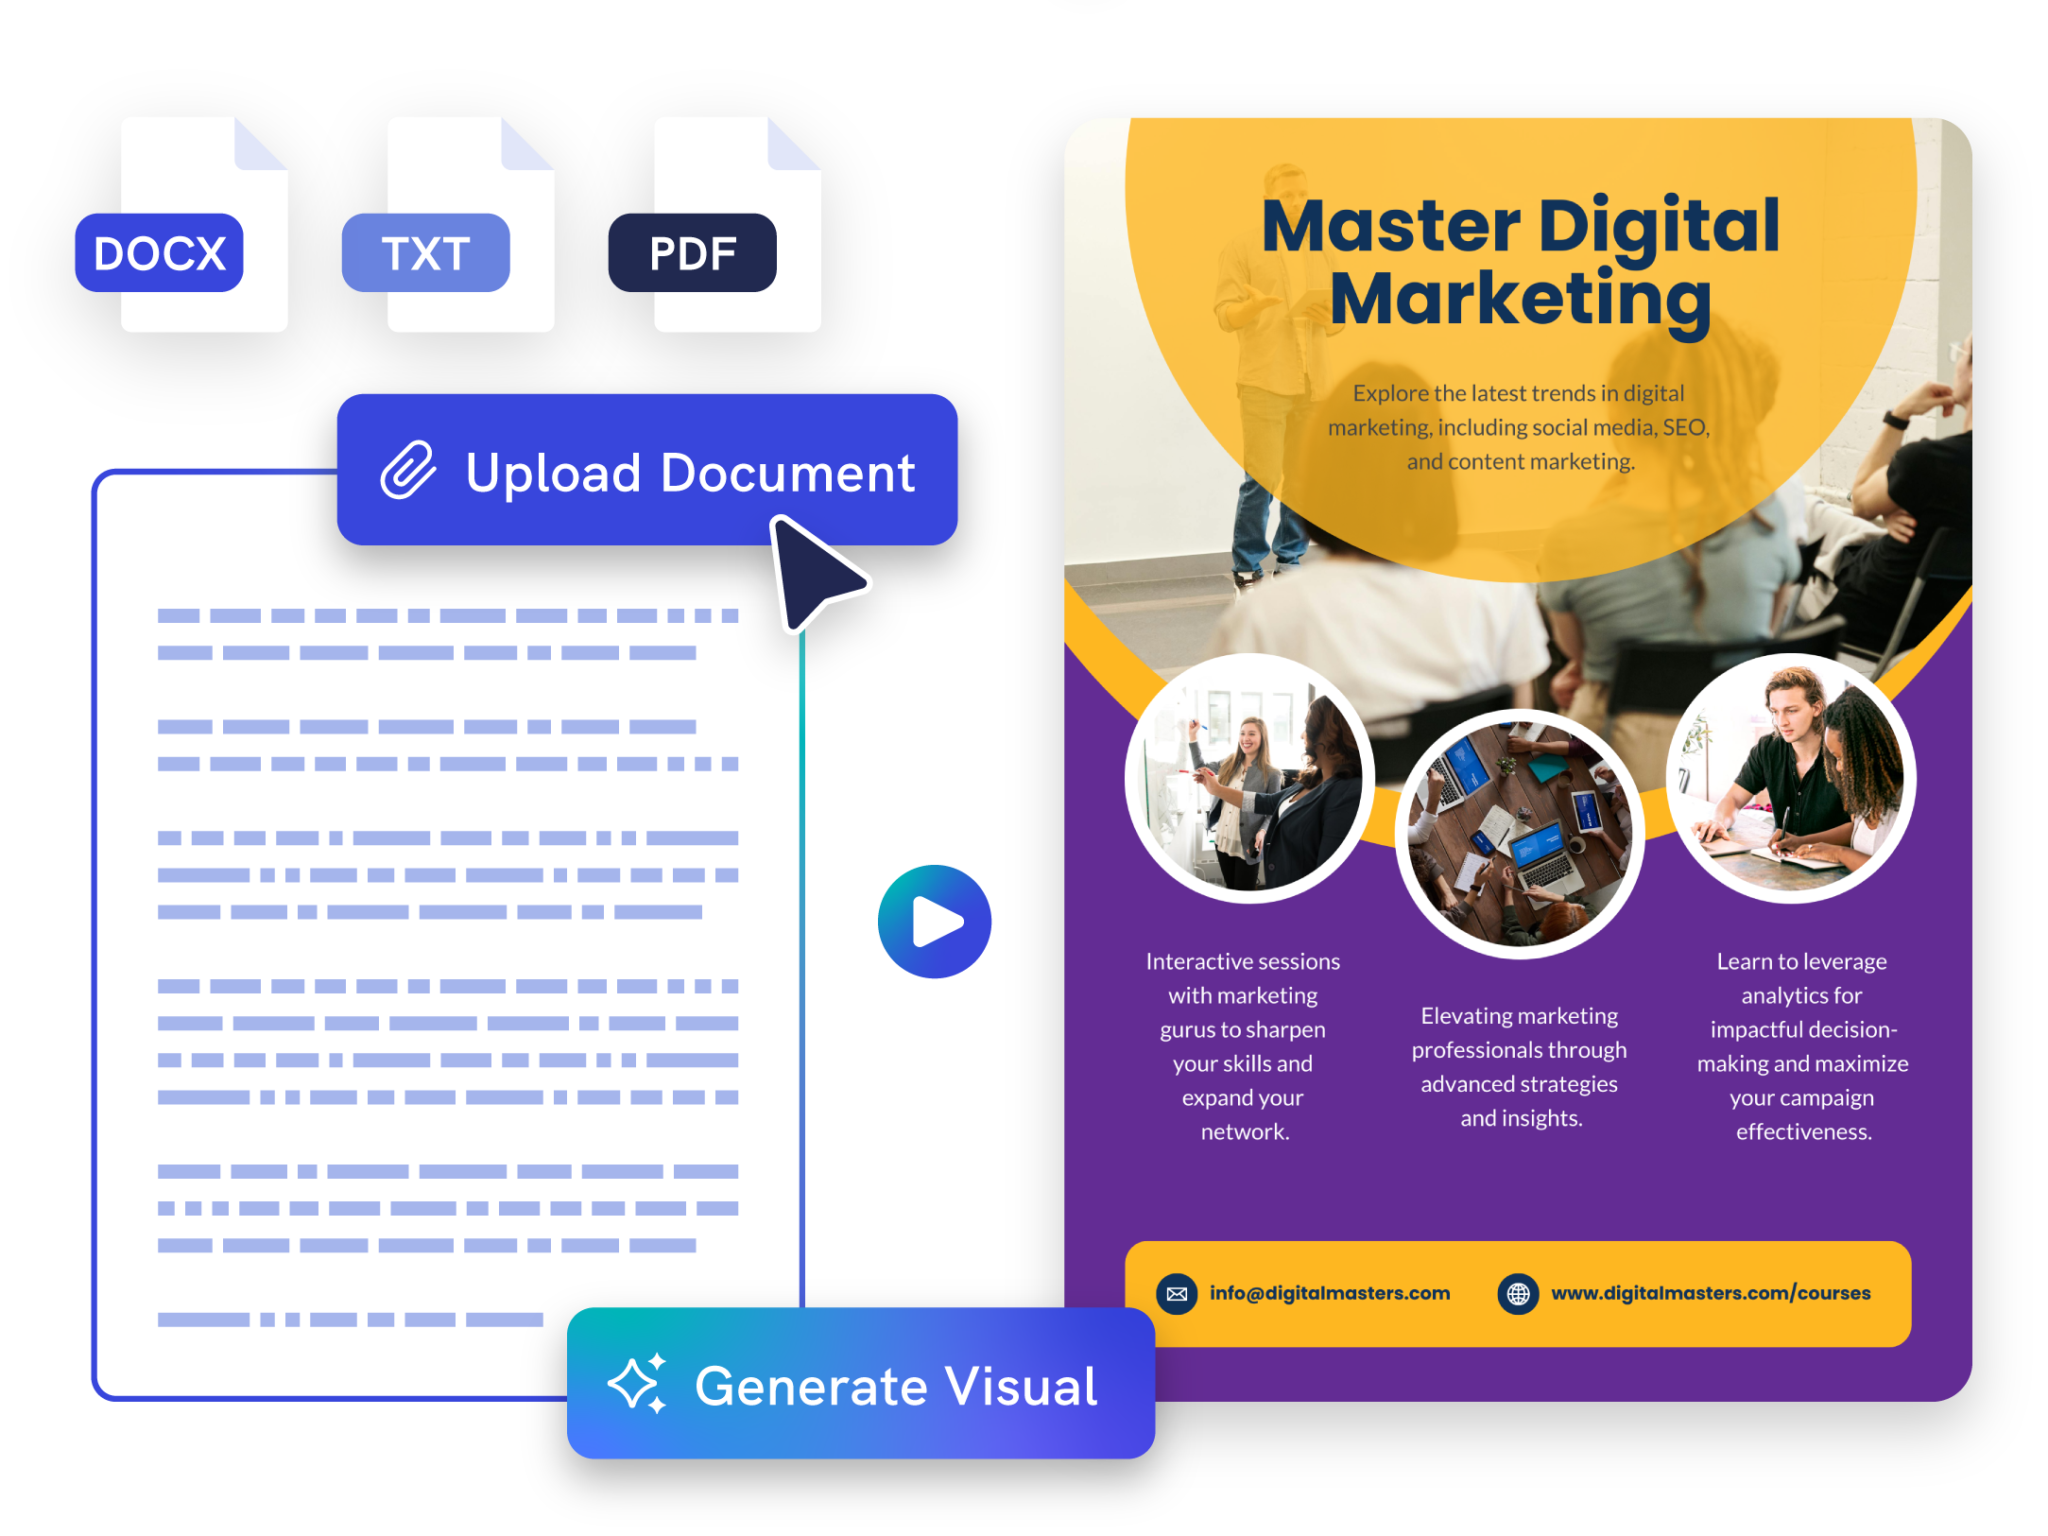
Simply paste your text or upload your document and watch Piktochart AI work its magic to generate infographics customized for you in seconds. Save time and boost your productivity by delivering engaging infographics in seconds.
Piktochart AI supports PDF, DOCX, and TXT format, making it versatile for your every need.
Make it creative
Create anything with AI image generator
Create unique photos and images that are contextualized to your needs with our advanced AI model. Put your creativity to the test and generate highly realistic images or scroll-stopping infographics that grabs attention.
Make it happen
Any subject, one stunning visual
Whether it’s business insights or educational themes, Piktochart AI offers AI-powered design for images like no other. Explore a world of stunning visuals that align with any topic.

Make it yours
Beyond generation; true customization
Our AI lays the groundwork with an expertly generated infographic, then hands the reins to you—enabling you to tailor and transform every element to enhance your visual story while remaining on-brand.
Make it structured
Intelligent design assistance with AI outline
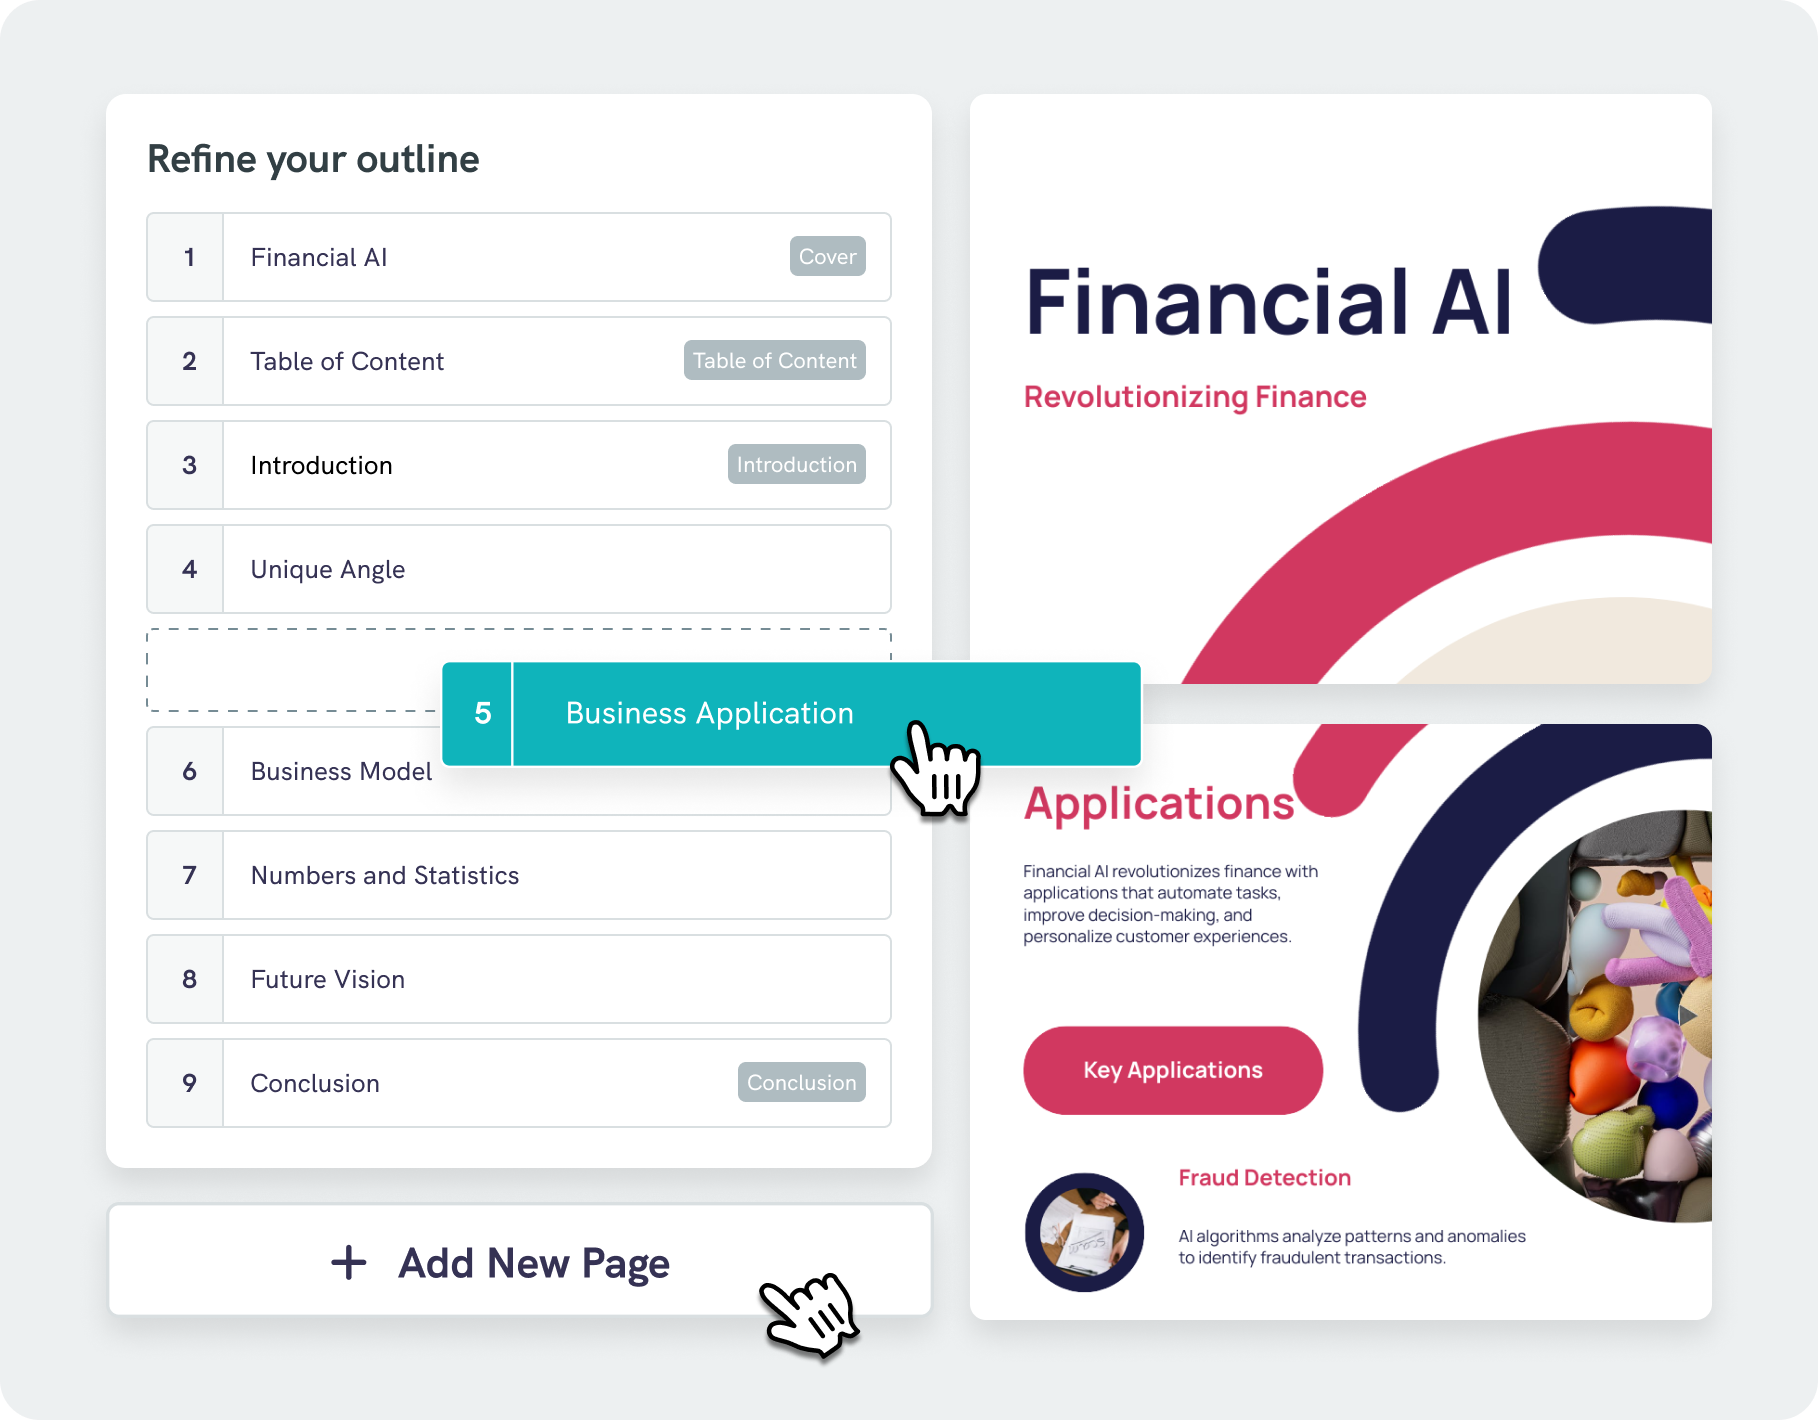
Our AI infographic generator does more than just place text on a page—our algorithms analyze your content and suggest visually appealing designs that boost readability and engagement.
With our AI outline feature, you can effortlessly organize your ideas into a clear, logical structure, keeping your focus on key points. Easily edit and refine your outline, saving both time and effort.
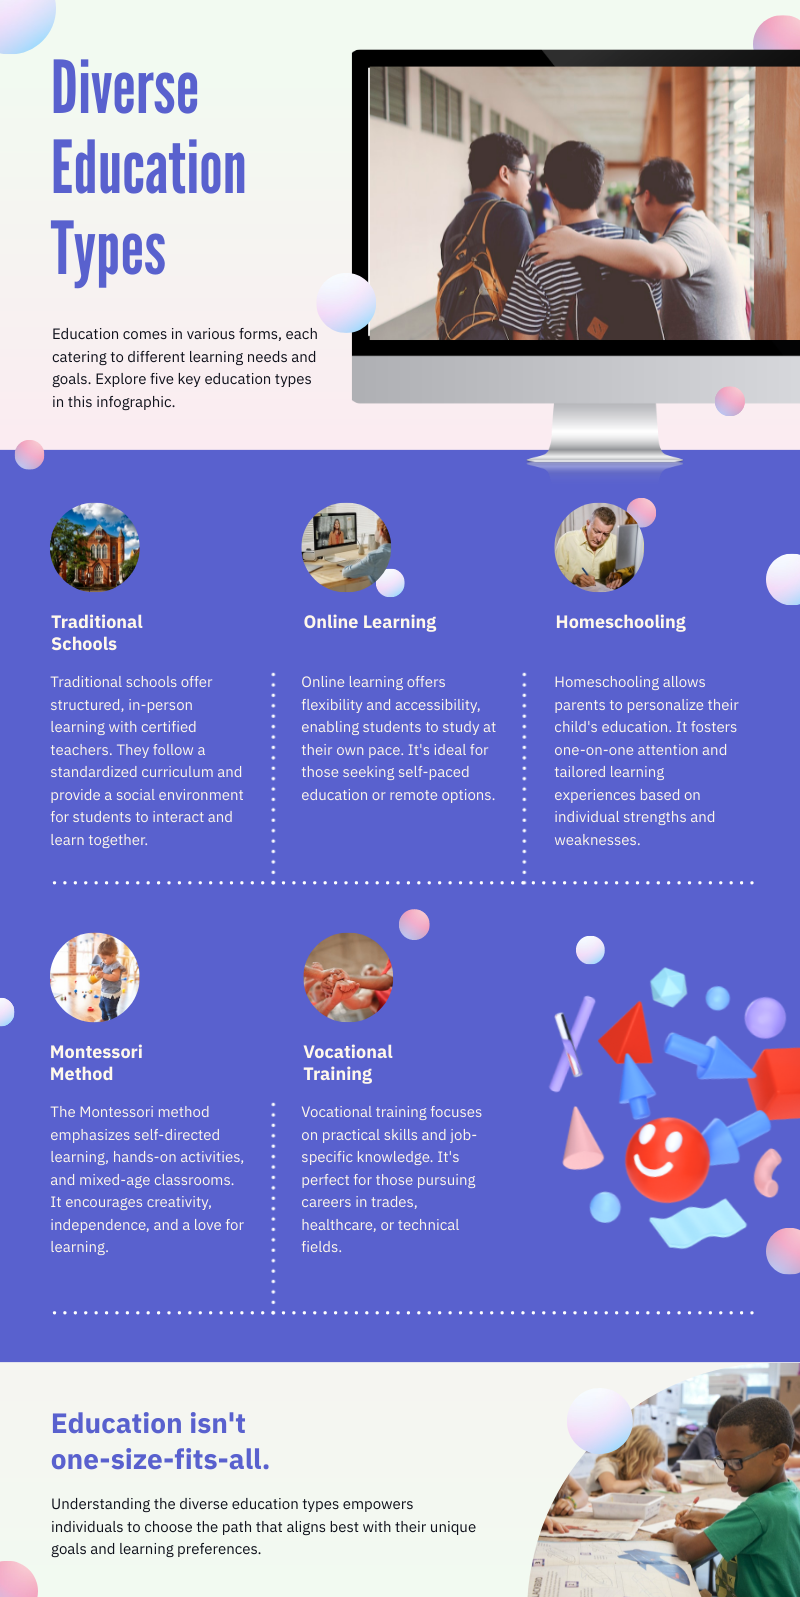
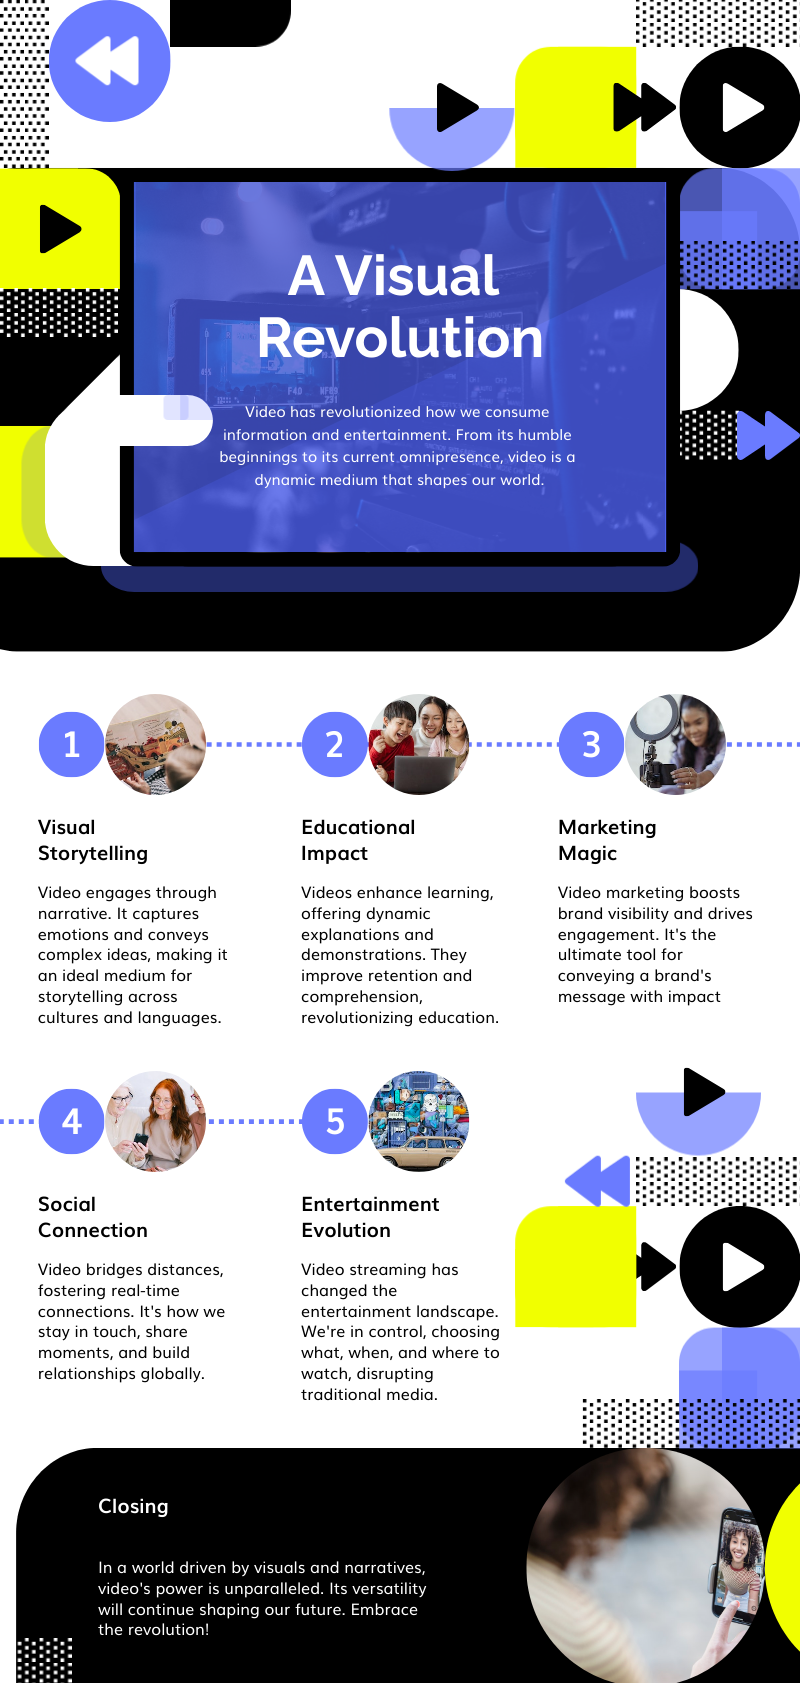
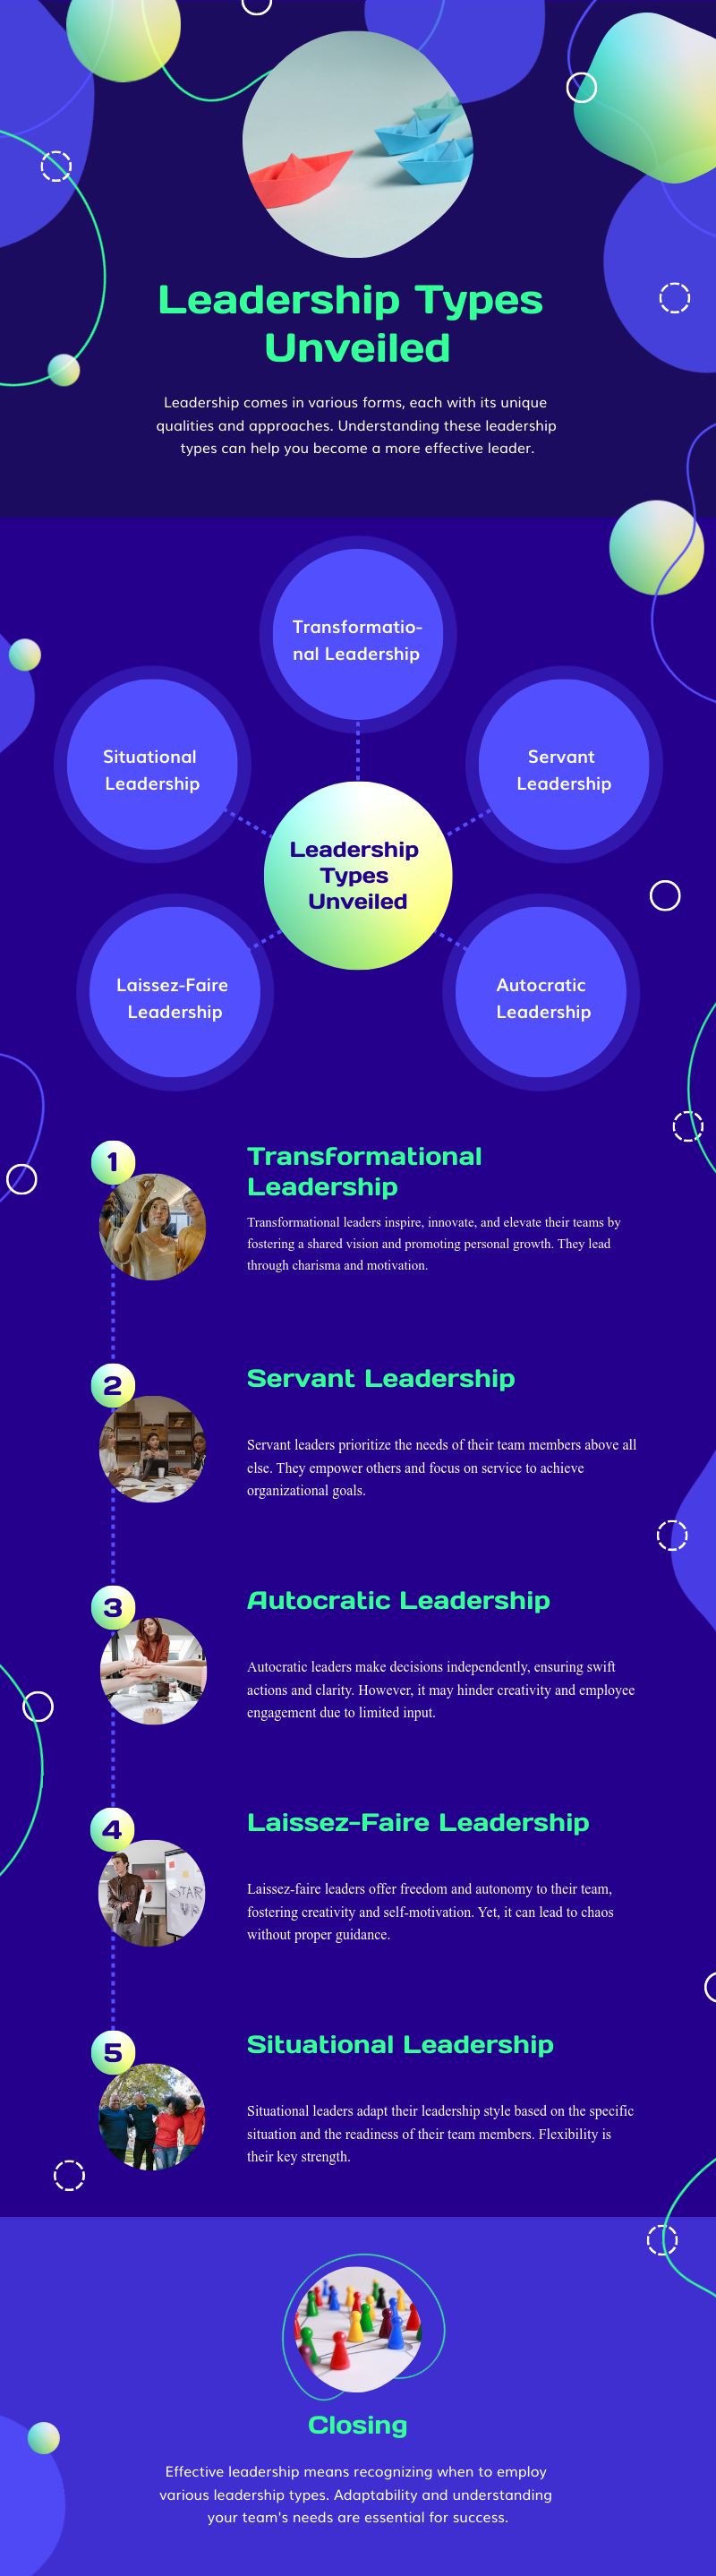
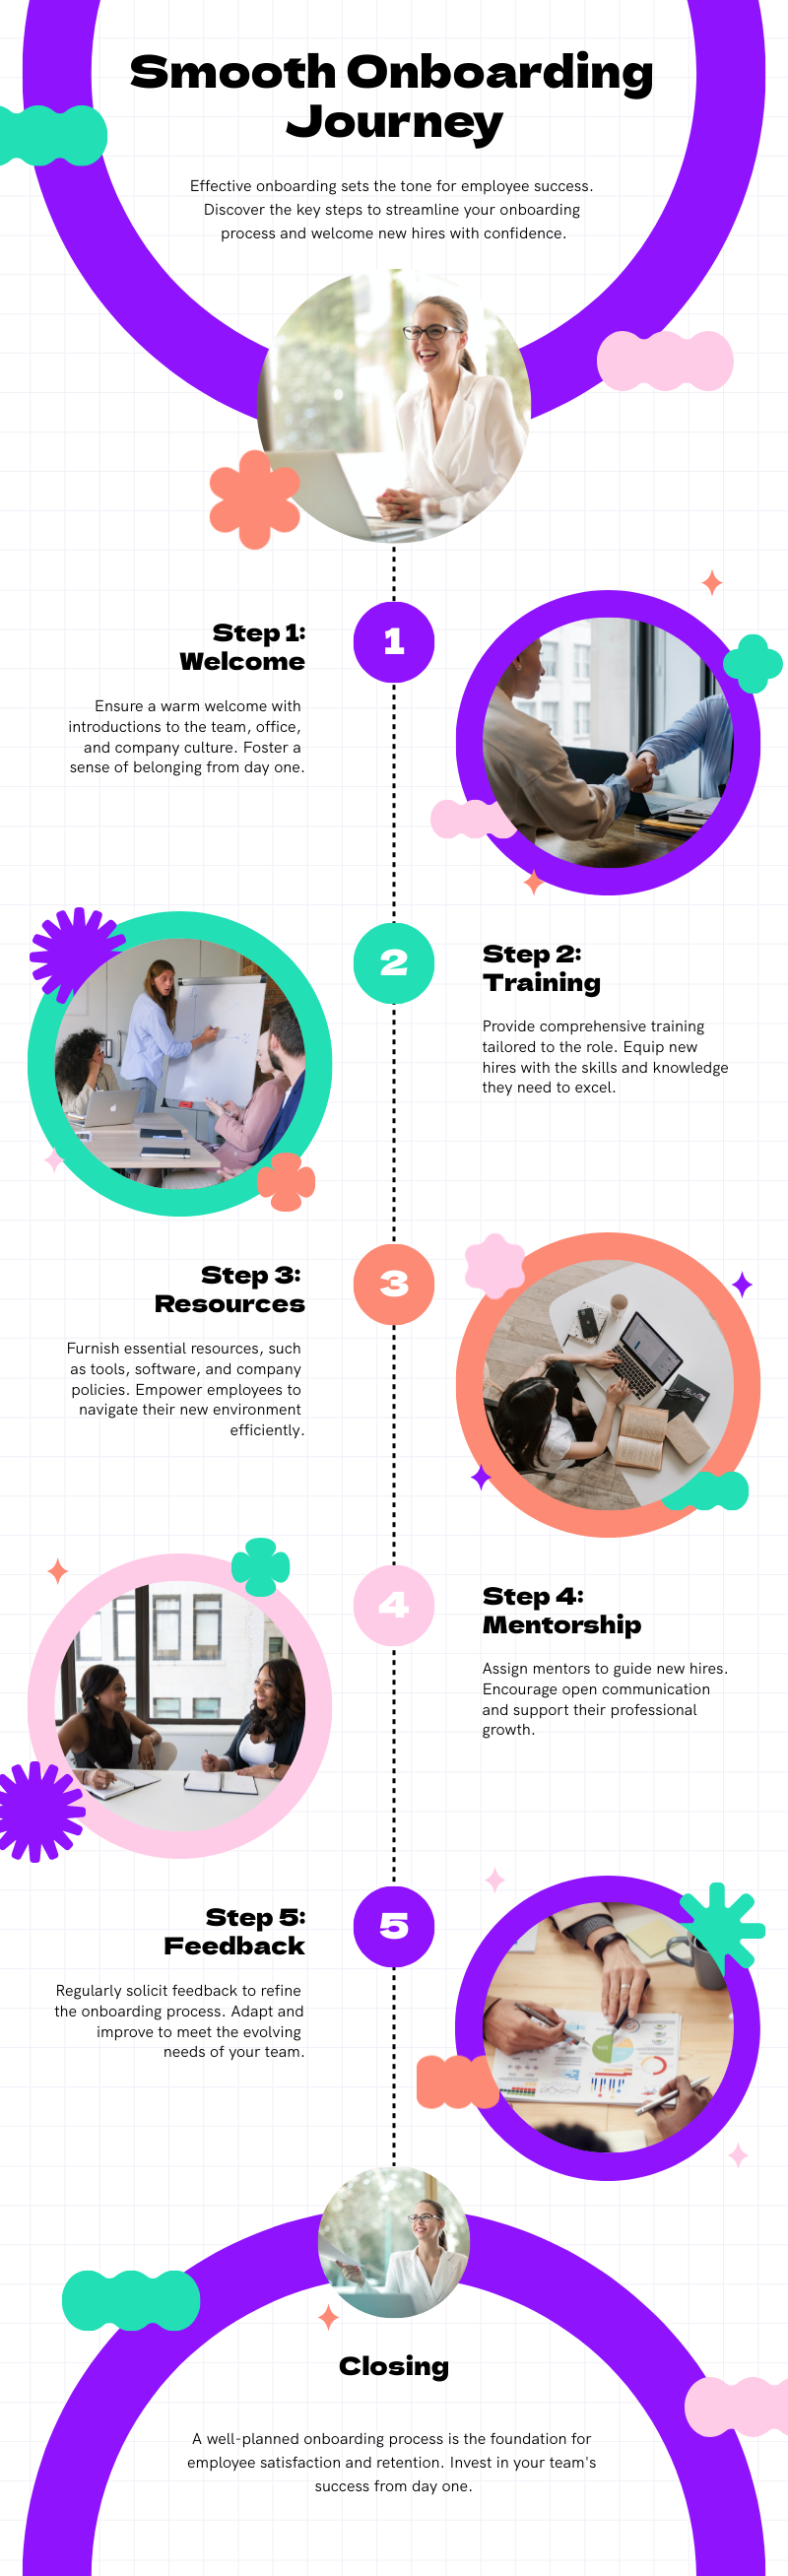
Infographics created using Piktochart’s AI-powered infographic generator

Hear what others are saying about Piktochart AI

“Infographics created with Piktochart have helped me during important meetings with administrators at school districts or foundations in the community. Without Piktochart, we would not be able to secure funding to support our work.”
Dr. Aaron Fischer
Dee Endowed Professor of School Psychology at University of Utah

“Piktochart is a no-brainer to use. People have told me to try another infographics design platform that is very world-renowned, but I tried it before, and I was not too fond of it. I think it goes back to the great design of Piktochart.”
Deborah Tan-Pink
Senior Communications Manager, Revolut
How to Create an Infographic Using AI
1. Name your narrative
In just a few words (up to 120 characters), tell us what story you’re itching to tell. Be it “Workplace Wellness Trends for 2024” or a crisp “Summary of Crossing the Chasm by Geoffrey A. Moore.”
2. Choose from our diverse library of infographic templates
Instead of starting from scratch, save time by diving into our premium templates designed to bring out the best in any topic. Once you’ve chosen your template, you’ll be in the editor.
3. Fine-tune in Piktochart Editor
4. Add images, icons, and other assets to the infographic creator
Elevate your infographic with bespoke elements with the drag and drop editor. Pick from a library of free images and visual assets to create an infographic that stands out or upload your own images into our free infographic maker.
5. Ready, Set, Share!
Done customizing your visual? Save and download in different formats, such PNG or PDF (Pro subscription required). Share it with your colleagues, inspire on your social media platforms, or embed it on your website.
AI-Powered Visualization for Any Topic
What kinds of infographics can be generated using this AI tool?
Navigating design elements and finding the right visual style can be daunting. With Piktochart AI, it’s easy to transform data into visually appealing infographics . Excellence made simple, just for you.
Press Release Infographic
Stand out for all the right reasons. Piktochart AI transform dense details into clear and engaging visual stories that resonate and spread. Ensure your news isn’t just read, but remembered and shared.
Internal Communication Infographic
Adaptable designs that are on-brand, every time. With Piktochart AI, transform your insights into compelling visuals in a heartbeat.
Fact Sheet for Communications
Craft bite-sized visuals that pack a punch. With our AI infographic maker, transform your data into designs that are as captivating as they are accurate.
Marketing Infographic
Targeted insights. Tailored visuals. Triumphant campaigns. At the click of a button, you can drive growth with high-quality infographics that convert leads and generate ROI.
Ready to use AI to create eye-catching infographics?
Join more than 14 million people who already design information with Piktochart’s free infographic maker.
FAQs
{
« @context »: « https://schema.org »,
« @type »: « FAQPage »,
« mainEntity »: [
{
« @type »: « Question »,
« name »: « Can I customize the infographic by adding images and charts? »,
« acceptedAnswer »: {
« @type »: « Answer »,
« text »: « Yes, definitely! Once you have selected the template, you will enter our editor. From there, you can add images and charts from our huge library of visual assets, or upload your own. Our AI infographic maker will help you produce visuals as well as any graphic designer. »
}
}, {
« @type »: « Question »,
« name »: « How many infographics can I generate? »,
« acceptedAnswer »: {
« @type »: « Answer »,
« text »: « Sign up for a free Piktochart account and receive 60 AI credits each month to explore our AI capabilities. Credits are used based on features, with 1 credit for topic generation, 3 credits for pasting text or uploading documents, and 25 credits for image generation. Upgraded plans come with even more credits: 250 credits for EDU/NPO Pro, 500 for Pro, and 1,000 for Business/Enterprise subscribers, all renewed monthly. Learn more here. »
}
}, {
« @type »: « Question »,
« name »: « How can I get better results? »,
« acceptedAnswer »: {
« @type »: « Answer »,
« text »: « We recommend you be as descriptive as possible about the topic that you are trying to cover. You may need to try different prompts for better results. »
}
}, {
« @type »: « Question »,
« name »: « How long does it take to create my infographic with AI? « ,
« acceptedAnswer »: {
« @type »: « Answer »,
« text »: « Piktochart AI gets the ground work done for you in under 10 seconds based on your topic of infographic. Once you’ve generated your infographic, you can further customise it with additional content or design elements. Read our guide on how to make an infographic. »
}
}, {
« @type »: « Question »,
« name »: « Do I need to sign up for Piktochart? »,
« acceptedAnswer »: {
« @type »: « Answer »,
« text »: « Yes, creating a free Piktochart account is necessary to edit, customize, or download your infographic. With a free account, you have 7 days of access with the standard free plan features, plus temporary perks such as full access to all templates and 60 AI credits. »
}
}, {
« @type »: « Question »,
« name »: « What types of infographics can I create? »,
« acceptedAnswer »: {
« @type »: « Answer »,
« text »: « The sky is the limit! You can make statistical infographics, timeline infographics, process infographics, comparison infographics, and much more. »
}
}, {
« @type »: « Question »,
« name »: « Why use an AI infographic maker? »,
« acceptedAnswer »: {
« @type »: « Answer »,
« text »: « An AI infographic maker simplifies the design process, making it faster, more accessible, and cost-effective while delivering high-quality, customizable results. This allows you to focus more on the content and messaging, ensuring your infographics effectively communicate your information. »
}
}, {
« @type »: « Question »,
« name »: « What are the rules that apply to my use of Piktochart AI? « ,
« acceptedAnswer »: {
« @type »: « Answer »,
« text »: « Read our terms of use here. »
}
} ]
}
Infographics Resources