Line Graph Maker
Create line graphs quickly by customizing line graph templates with Piktochart. No design experience needed, and for free.

Our line graph maker is chosen by professionals and educators worldwide


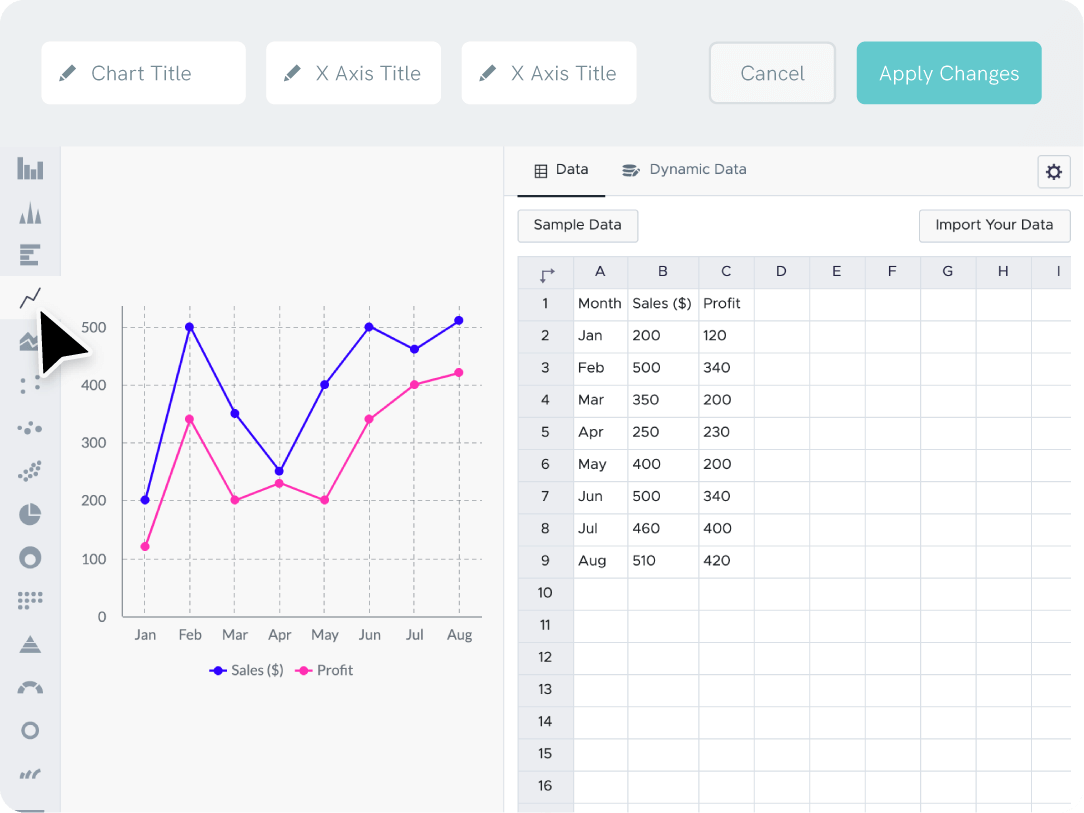
Quick and Easy Data Entry With Piktochart’s Line Graph Maker Tool
Link up your Excel or Google Sheets file to create line graphs that automatically update when your data does.
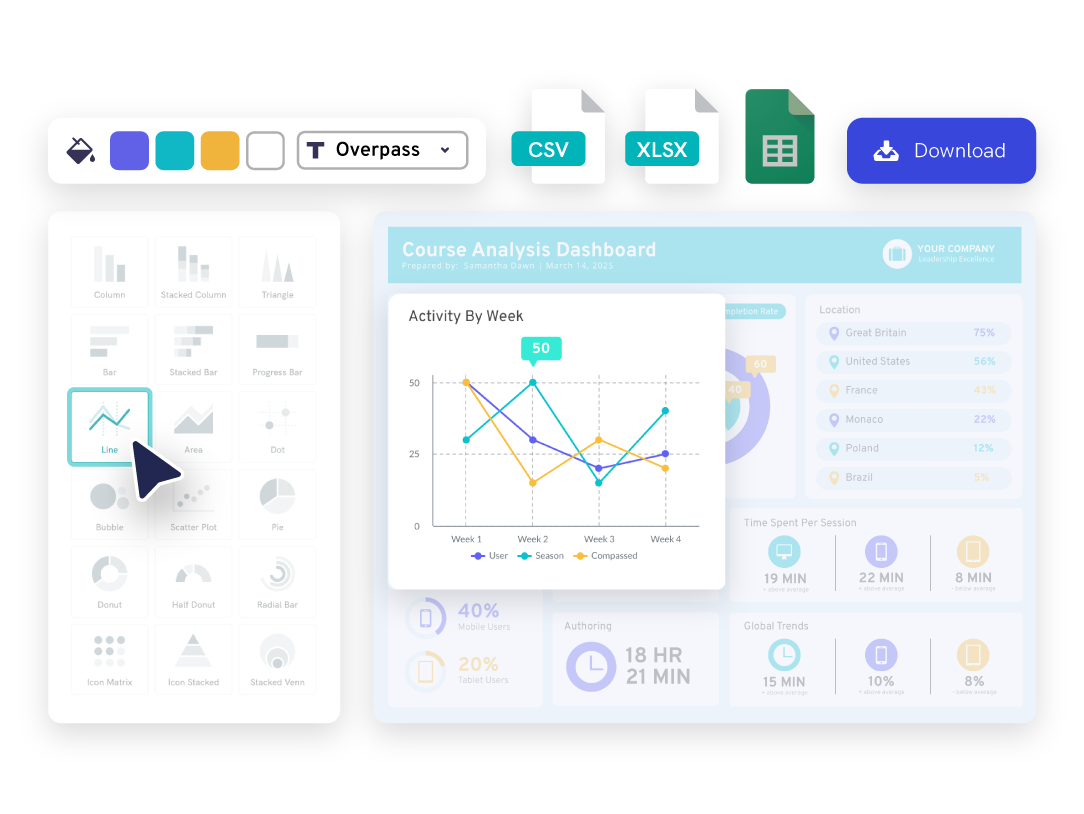
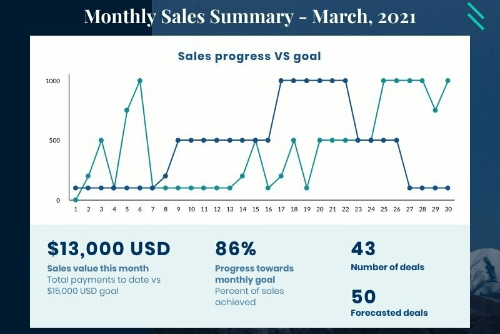
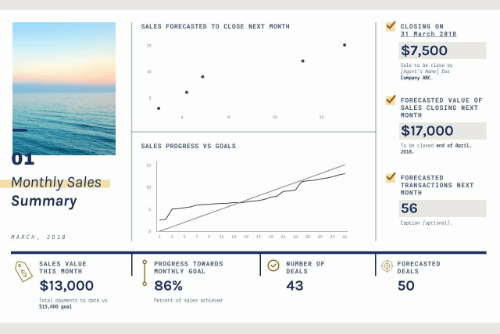
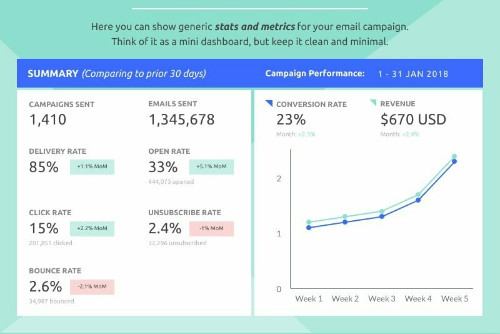
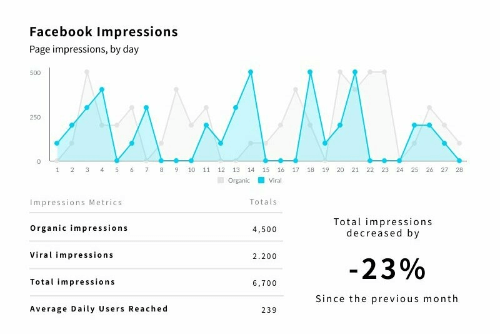
With our tool, you can combine various charts into one page to create a professionally-looking, interactive web dashboard.
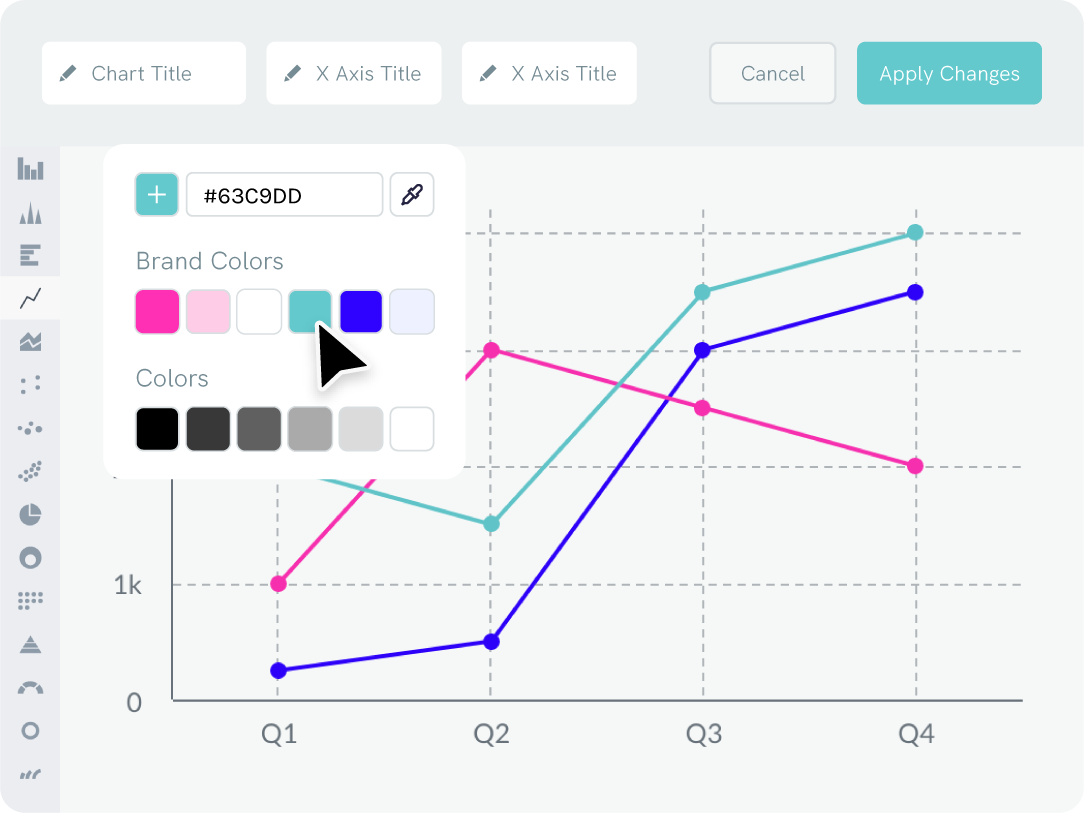
Branding
Adjust the Colors of Your Line Graph to Match Your Brand
Want to use your company’s fonts in your line graphs? Just drag your logo or a screenshot of your website into our line graph maker to extract your brand colors. Then, simply add the colors to the line chart in seconds.
Your custom color palette and uploaded fonts will always be accessible in the editor for future use.

“Infographics created with Piktochart have helped me during important meetings with administrators at school districts or foundations in the community. Without Piktochart, we would not be able to secure funding to support our work.”
Dr. Aaron Fischer
Dee Endowed Professor of School Psychology at University of Utah

“Piktochart is a no-brainer to use. People have told me to try another infographics design platform that is very world-renowned, but I tried it before, and I was not too fond of it. I think it goes back to the great design of Piktochart.”
Deborah Tan-Pink
Senior Communications Manager, Revolut
Cómo hacer un gráfico de líneas gratis
Log in
Sign up or log into your Piktochart account.
Pick a template
Pick from pre-made graph templates made by designers or start from scratch.
Open the chart maker
Go to tools and open up the chart maker to access our line graph maker.
Enter your data
Copy-paste your data points and data values straight from Excel, CSV, or link a Google Sheet.
Adjust to your liking
Adjust data values, labels, x-axis, y-axis, graph title, background color, and more. Once you’re happy with the results, you can create your line graph for free.
Download or share
Download your graph as a JPG, PNG, or PDF file, and share on social media.

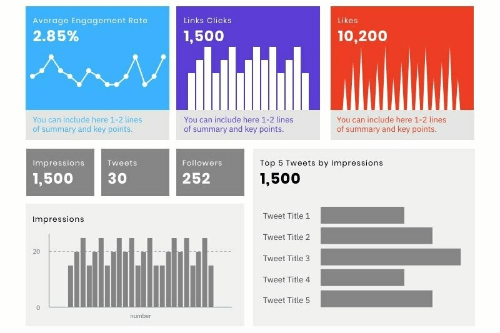
Content creation
Add Your Line Graph to Any Format
You can add great visuals to any format, whether it’s a presentation or pitch deck. Start by creating a line graph with our graph maker, using a template designed by experts or creating a graphic from scratch. After customizing the template for free, you can add it to your infographic or slides in just a few clicks.

Repurposing
Create Once, Easily Share & Download, Then Use Forever
Save hours re-creating the same report every month when you create line graphs with our tool. Once you’ve created one with your brand logos and colors, you can store and organize your templates and past projects in folders.
Next time you need to update your doc or make a new line graph, you can quickly pick up where you left off. All your line graphs, presentations, and visuals are in one place.
Add Your Line Graphs to Any Template

¿Listo para crear gráficos de líneas?
Join more than 14 million people who already design information with Piktochart’s free line graph maker.
FAQs
{
«@context»: «https://schema.org»,
«@type»: «FAQPage»,
«mainEntity»: [
{
«@type»: «Question»,
«name»: «What is a line graph?»,
«acceptedAnswer»: {
«@type»: «Answer»,
«text»: «A line graph is a type of chart where a line connects different points and values. It’s meant to show the progression of a certain metric, such as revenue, costs, etc.»
}
}, {
«@type»: «Question»,
«name»: «Can I edit the appearance of a line graph?»,
«acceptedAnswer»: {
«@type»: «Answer»,
«text»: «Yes. You can customize the appearance of a line graph by changing the colors, font, and design. Line graph makers that are available online (like Piktochart) allow flexibility in creating line graphs without requiring design experience.»
}
}, {
«@type»: «Question»,
«name»: «Can I add a trendline to a line graph?»,
«acceptedAnswer»: {
«@type»: «Answer»,
«text»: «You can add a trendline to a line graph using Microsoft Excel.»
}
}, {
«@type»: «Question»,
«name»: «What types of data are best suited for a line graph?»,
«acceptedAnswer»: {
«@type»: «Answer»,
«text»: «The best types of data for a line graph are sales, marketing results, temperatures, and any data showing progression or evolution over time.»
}
}, {
«@type»: «Question»,
«name»: «When do you use a line graph?»,
«acceptedAnswer»: {
«@type»: «Answer»,
«text»: «Line graphs are good for when you want to illustrate progression or evolution over time. Insert it in a financial report to show progress and results. With Piktochart’s online graph maker, non-designers can edit line graph templates and create presentations online in a few minutes.»
}
}, {
«@type»: «Question»,
«name»: «What should a line graph include?»,
«acceptedAnswer»: {
«@type»: «Answer»,
«text»: «A line graph includes a title (optional), an x (horizontal) and y-axis, the data, and a legend. The source of the data would also be referenced for accuracy.»
}
}, {
«@type»: «Question»,
«name»: «What options can I customize on the line graph?»,
«acceptedAnswer»: {
«@type»: «Answer»,
«text»: «In Piktochart, you can add the chart title, edit the legend, axes title, labels, data formats, colors, grid, and data labels. The tool’s features allow users to change the graphics, add brand colors, their own data, and fully customize the free charts templates.»
}
} ]
}
Graph Resources