The new way of creating clear and compelling graphs

Effortless Creation
From prompt or data file to graph in seconds
Skip manual chart formatting. Describe the graph you need, paste raw data, or upload a CSV, DOCX, PDF, or TXT file, and Piktochart AI turns it into a clear bar, line, or pie chart you can edit.
Start creating
Customization Tailored to You
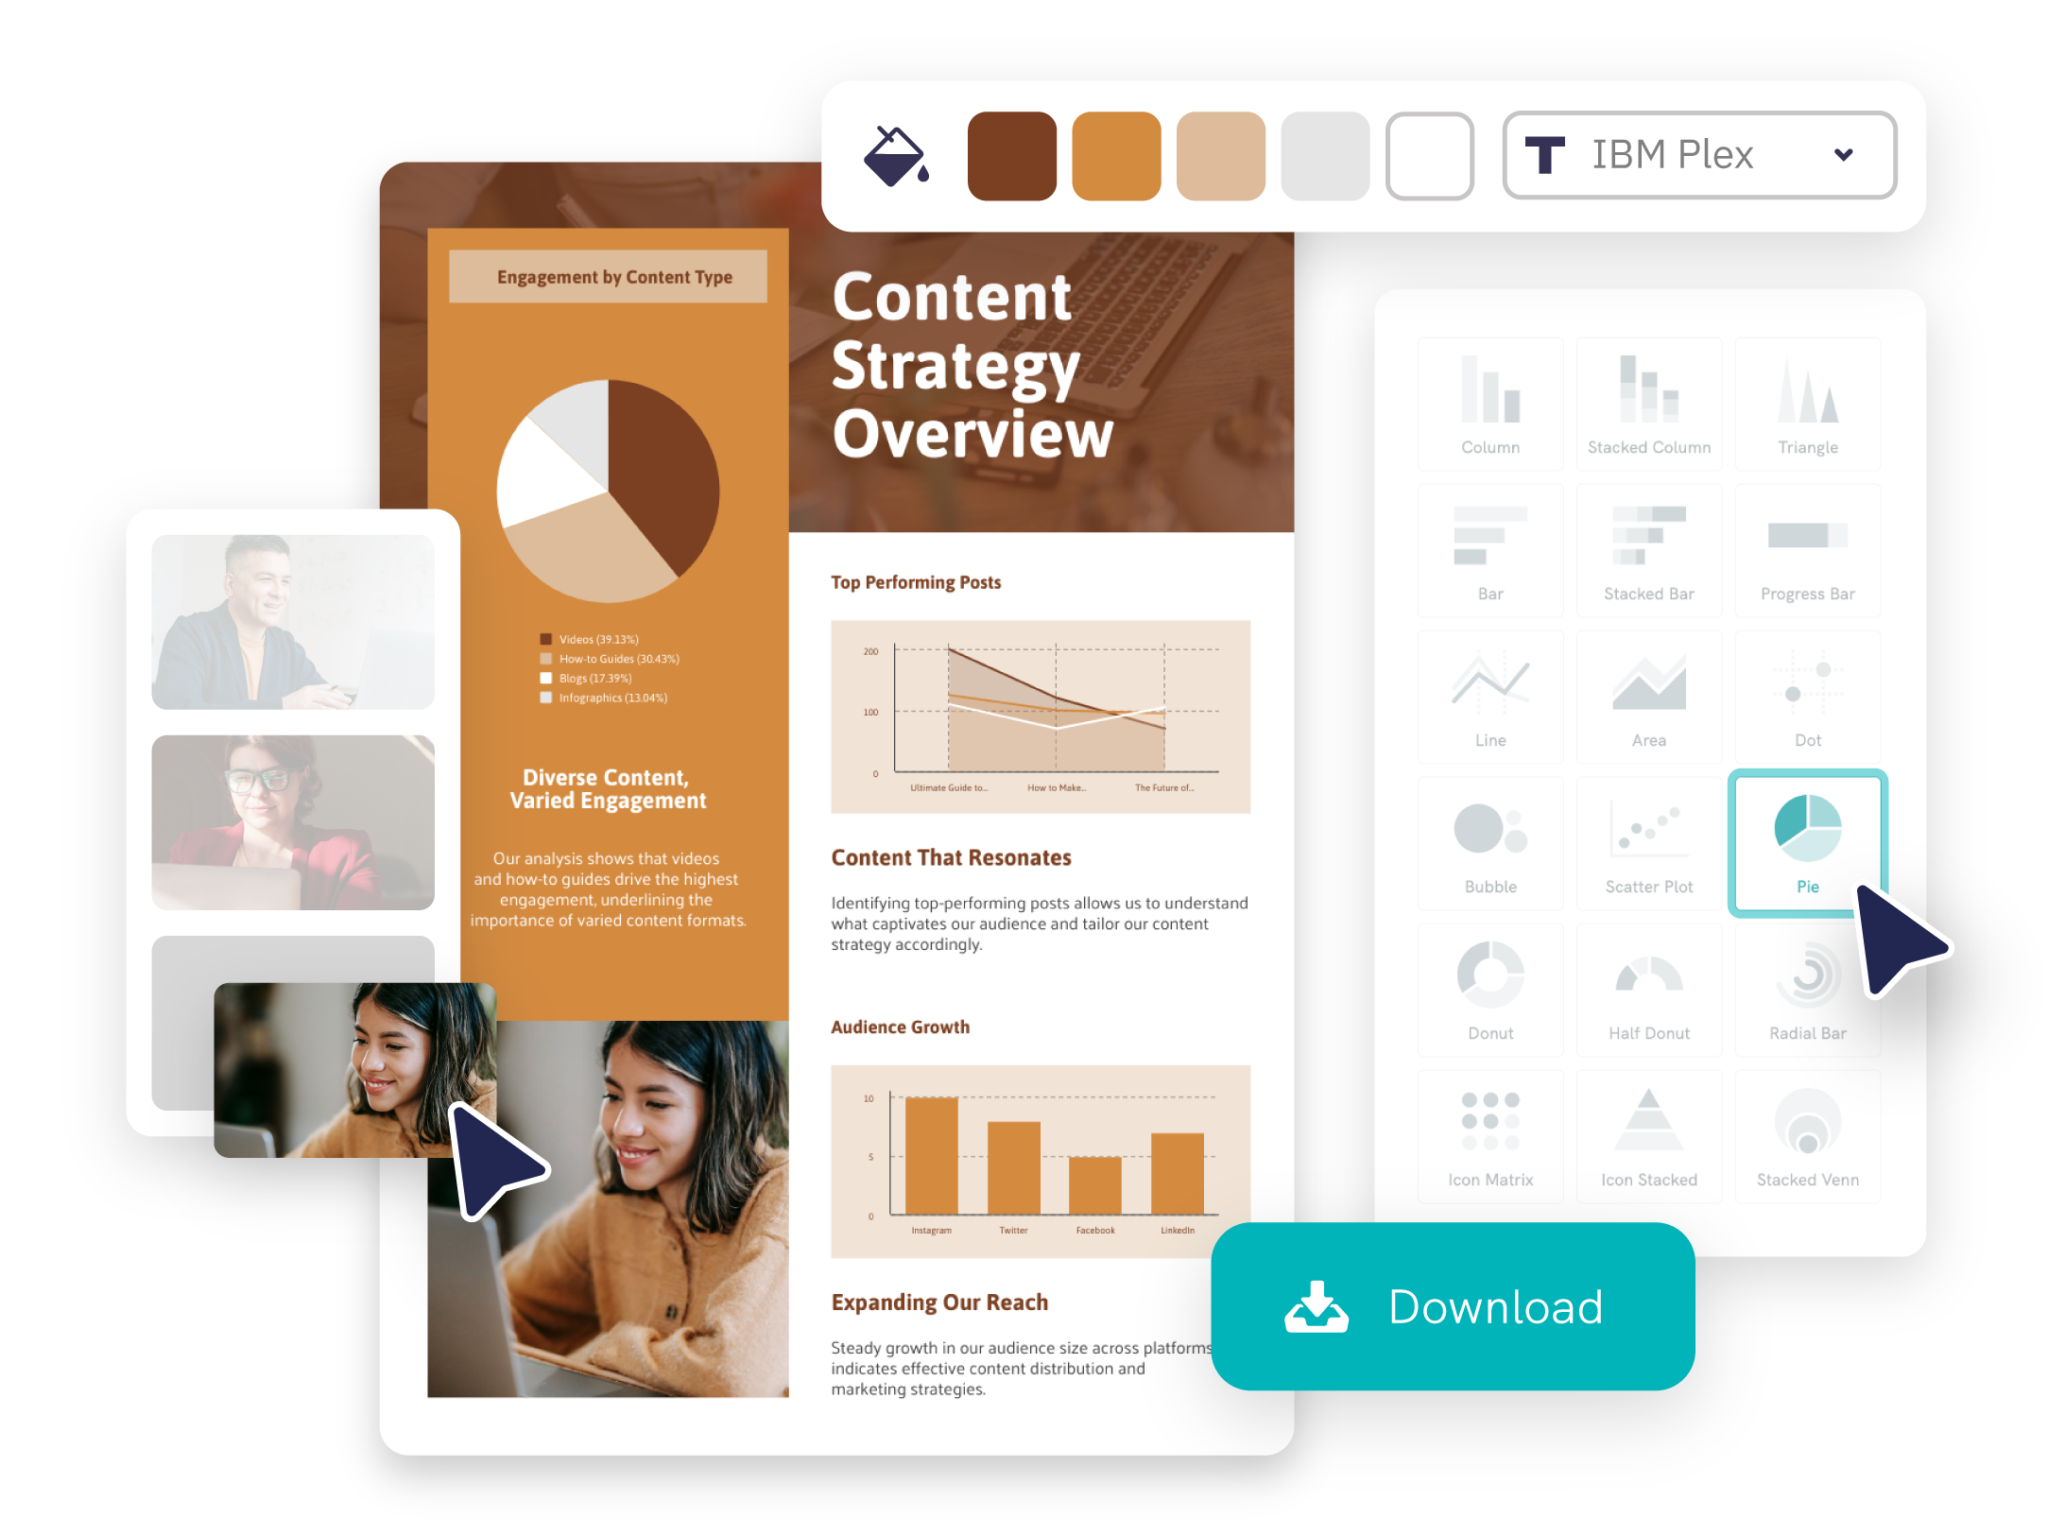
Customize labels, colors, and layouts
After AI creates your first graph, use Piktochart’s drag-and-drop editor to adjust labels, axis titles, data values, colors, fonts, and layout so the final visual matches your report, presentation, or brand.
Start creating
Simplified Design Process
Create charts from spreadsheets and text prompts
Turn a spreadsheet, survey summary, performance report, or plain-English prompt into a graph without opening a complicated BI dashboard. For full manual control over advanced chart types, use Piktochart’s graph maker.
Generate visual from documentTrusted by Industry Leaders

Marketers
- Visualize marketing campaign results, customer demographics, and market trends, facilitating data-driven decision-making.
- Engaging, easy-to-understand reports for clients, showcasing campaign performance, ROI, and key marketing metrics.
- Identify emerging trends and forecasting future market movements.

HR and Learning and Development Reports
- Highlight progress, identify areas for improvement, and facilitate effective performance reviews.
- Visually represent the impact and effectiveness of training programs.
- Compile and interpret data on workforce diversity, employee satisfaction, and organizational culture.

NGOs and Government Organizations
- Illustrate impact on communities by showcasing progress on projects, beneficiary stories, and fund utilization, essential for donor reports and stakeholder updates.
- Reports on donation usage, program effectiveness, and organizational financial health.
- Analyze program data, helping to assess effectiveness, identify areas for improvement, and inform future project planning and resource allocation.

Researchers
- Transform complex datasets into clear, comprehensible visuals, aiding in the presentation of research findings.
- Easy sharing and editing of reports, essential for multi-author studies and publications.
- Prepare reports for academic journals or conferences, aligning with publication standards.
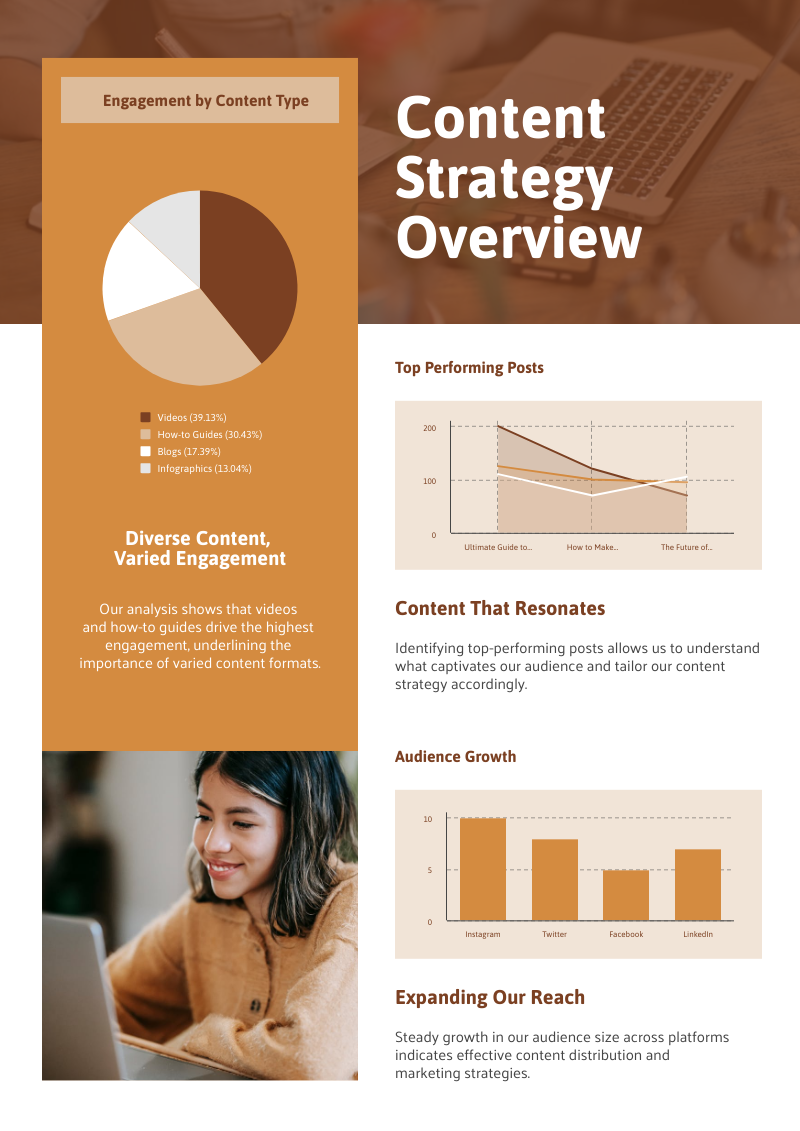
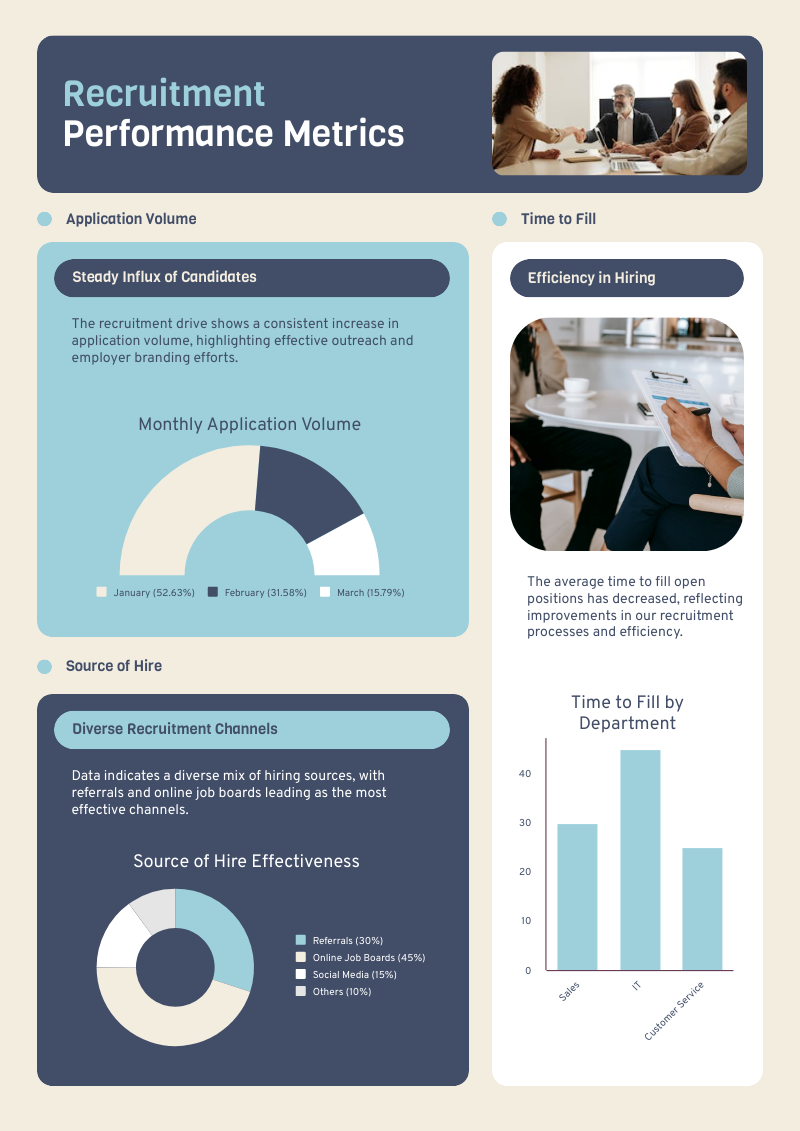
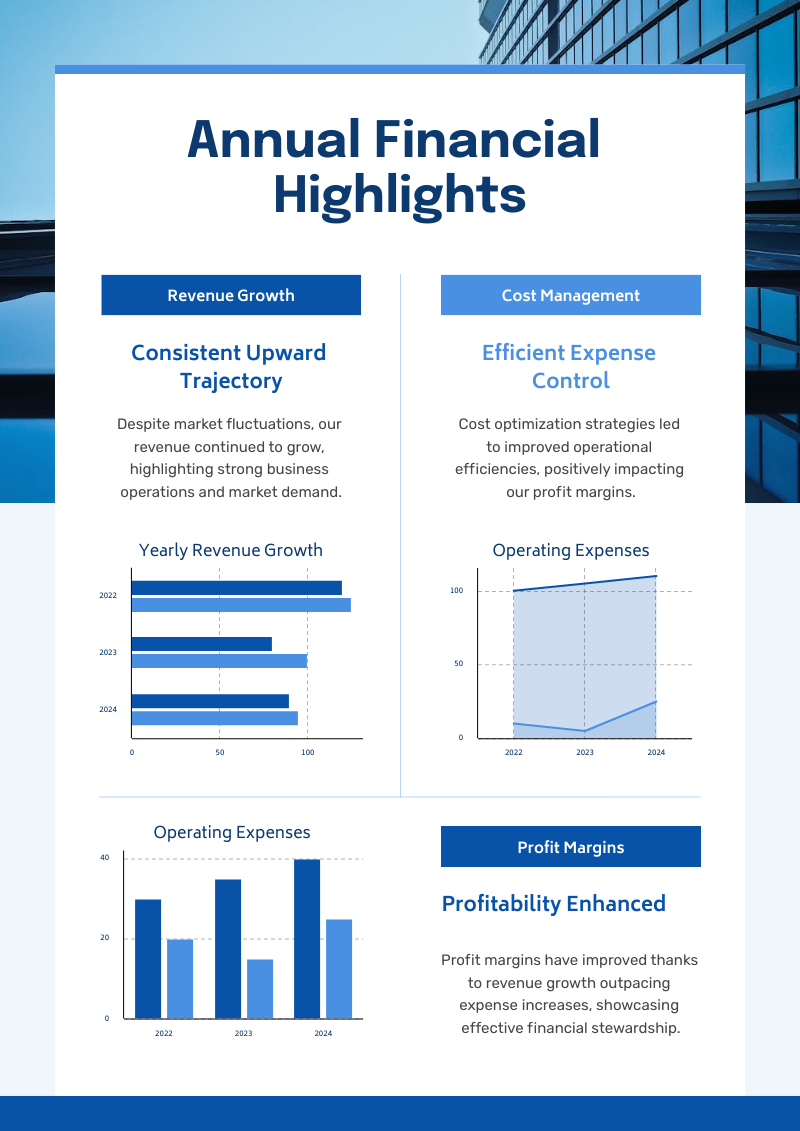
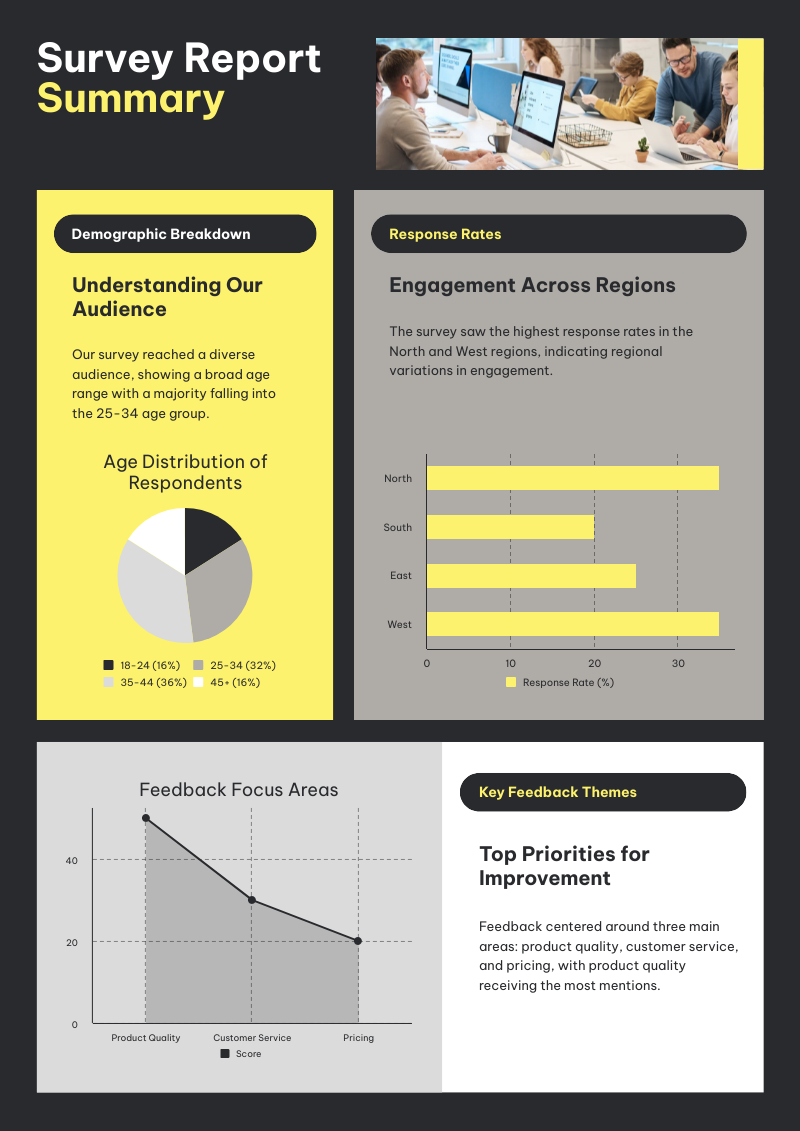
Graphs created using Piktochart’s AI-powered graph generator


How to create a graph using AI
1. Describe your graph or upload data
Start with a plain-English prompt, paste raw numbers, or upload a CSV, DOCX, PDF, or TXT file. For example: “Create a bar graph showing Q1 revenue by region from this spreadsheet.”
2. Let AI build the first draft
Piktochart AI reads your input, chooses a suitable graph format, and creates a polished visual in seconds. It works best for bar graphs, line graphs, and pie charts.
3. Customize the graph
Edit labels, axis titles, colors, fonts, data values, and layout in the drag-and-drop editor. Add icons, supporting text, or brand elements when the graph needs more context.
4. Download, share, or embed
Export the finished graph as PNG or PDF, share it by link, embed it on a page, or add it to a Piktochart report, presentation, or infographic.
AI-Powered Visualization for Any Topic
What types of graphs can you create with AI?
Piktochart AI focuses on the graph types most teams use for everyday communication: bar graphs, line graphs, and pie charts. These cover comparisons, trends, and proportions without requiring spreadsheet or design expertise.
Bar graphs
Use bar graphs to compare values across categories, such as revenue by region, survey responses, product performance, or department budgets.
Line graphs
Use line graphs to show change over time, including traffic growth, monthly sales, customer satisfaction, or campaign performance.
Pie charts
Use pie charts to show part-to-whole relationships, such as budget allocation, audience segments, or market share.
Sample graph prompts that work
Try prompts like “Make a line graph of monthly website traffic,” “Create a pie chart of marketing budget by channel,” or “Turn this Excel data into a bar graph.” For scatter plots, advanced manual chart editing, and full control over every data point, use the graph maker.
Ready to use AI to create impactful and engaging graphs?
Join more than 14 million people who already use Piktochart to craft amazing visual stories.