Creador de gráficos comparativos en línea gratis
Tener que tomar una buena decisión mientras revisas párrafos de texto no siempre es la mejor manera de hacerlo. Una infografía limpia que visualice los pros y los contras es una mejor opción. Con nuestro creador de gráficos de comparación en línea gratuito, puede comparar dos productos, resaltar los pros y los contras de una idea o crear una infografía simple que explique lo que se debe y lo que no se debe hacer en su actividad favorita.


Colaboración
Trabajen juntos en una gráfica de comparación
Invite a los miembros de su equipo a trabajar en una gráfica de comparación contigo. Comparte tu gráfica, los activos de tu marca y revisa las gráficas de tus compañeros sobre la marcha. Con Piktochart, todos están en el mismo canal.
Crea una gráfica de comparación
Desarrollo de una marca
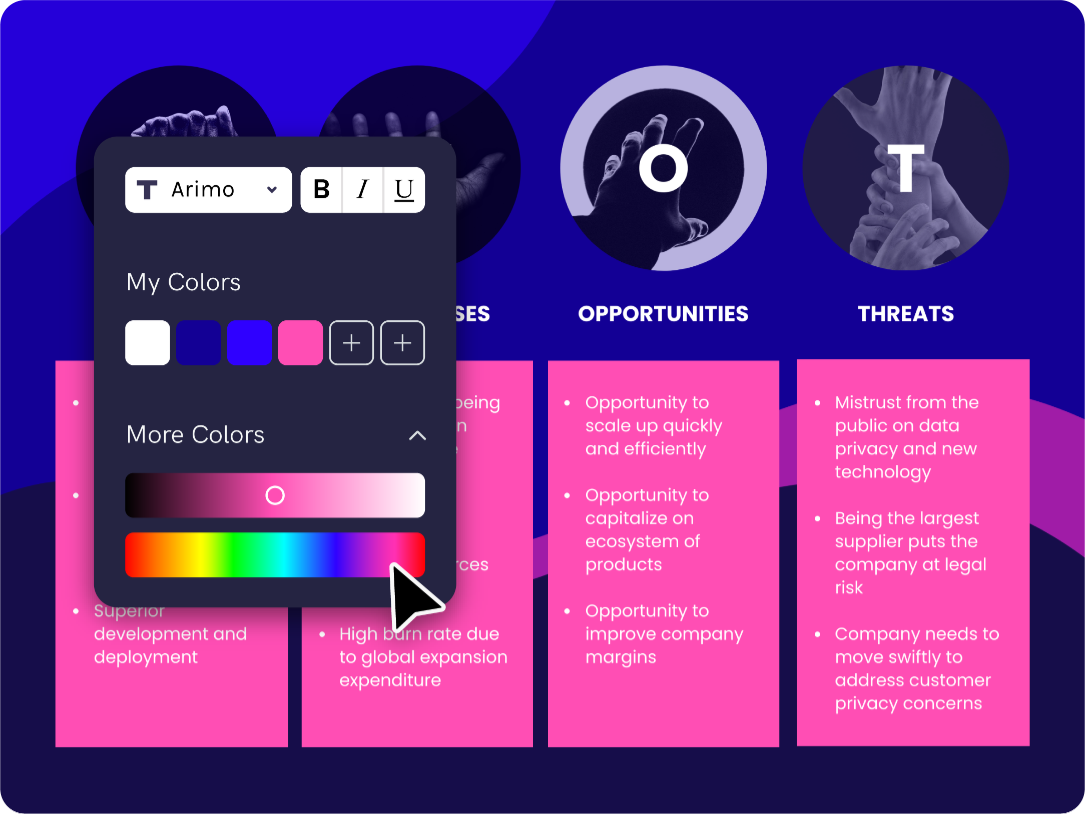
Mantén tu gráfica de comparación apegada a tu marca
¿Necesitas asegurarte de que todas tus tablas de comparación coincidan con tu marca? No hay problema. Arrastra y suelta tu logo o una captura de pantalla de tu sitio web para extraer de manera mágica los colores de tu marca. ¿Quieres usar las fuentes de tu empresa? Tu paleta de colores personalizada y las fuentes que hayas subido siempre estarán a tu disposición en el editor. Cada gráfica de comparación se puede ajustar para encajar con tu marca.
Crea una gráfica de comparación
Activos
Enriquece tus gráficas de comparación con imágenes e íconos
Esas épocas en las que buscaba la imagen, la ilustración o el ícono perfectos terminaron. Con la librería gratuita de Piktochart de gráficos, componentes de diseños y plantillas, la inspiración visual que estás buscando está ahí, donde la necesitas. Crear tu hermosa gráfica de comparación nunca había sido tan fácil.
Crea una gráfica de comparación

Reutilización
Crea una vez, úsalo para siempre
Con una cuenta para equipos, no hay necesidad de pasar horas re-creando mismo reporte cada semana o cada mes. Organiza tus plantillas y proyectos anteriores en carpetas. Haz que sea fácil para los miembros de tu equipo readaptar el contenido sobre la marcha, lo que al final les ahorrará tiempo.
Crea una gráfica de comparaciónCómo hacer un gráfico comparativo
- Reúna tus datos
Un buen gráfico comparativo comienza con una buena idea y buenos datos. La mejor manera de empezar es sentarse, agarrar un trozo de papel y anotar todos los puntos diferentes para cada elemento que estás comparando
- Escoge una plantilla
Podría parecer que todos tus compañeros de repente se convirtieron en expertos en Photoshop, pero la verdad es que la mayoría de ellos empiezan desde plantillas y no en un lienzo en blanco. Si no eres diseñador, empezar desde cero no es la mejor opción. En su lugar, utiliza una de nuestras plantillas de gráficos comparativos creadas por diseñadores profesionales. Puedes escoger entre diferentes tipos, como plantillas de infografía, presentaciones, informes, carteles y más.
- Agrega un gráfico comparativo a tu elemento visual
Conoce nuestros componentes de diseño y escoge una tabla comparativa. Cada elemento tiene su propio diseño y sabor. Puedes agregar tantos gráficos como quieras.
- Ajústalo según tu gusto
Una vez que hayas agregado un gráfico comparativo, ajústalo según tus necesidades. Añade tu texto, personaliza los colores y las fuentes, agrega más gráficos para apoyar tus argumentos.
- Comparte tu gráfico comparativo
Una vez que hayas terminado de editar tu gráfico, descárgalo como un archivo jpg, png, pdf, o compártelo con los miembros del equipo. ¿Necesitas que tu jefe te dé su aprobación? Con una cuenta de Piktochart Team, puedes hacer que las partes interesadas comenten sobre tu elemento visual.
Plantillas de gráficas de comparación