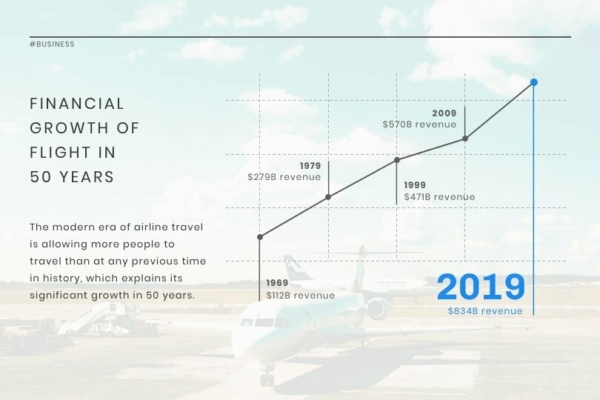
Airline Industry
Posters · Fact
Edit for freeYou'll be asked to log in or sign up for a free Piktochart account first.
Making an engaging News Visualization that helps your content reach a large audience can sometimes become very difficult.To help do this job easily, Piktochart presents you the Airline Industry News Visualization Template!Add graphics like shapes, lines, and more to create a unique design!
Available File Type
Customization
100% customizable
Tags
Template Details
Once done, download the template in PDF or PNG format! Try Piktochart and create more creative News Visualization Templates!
More Templates Like This
 Posters
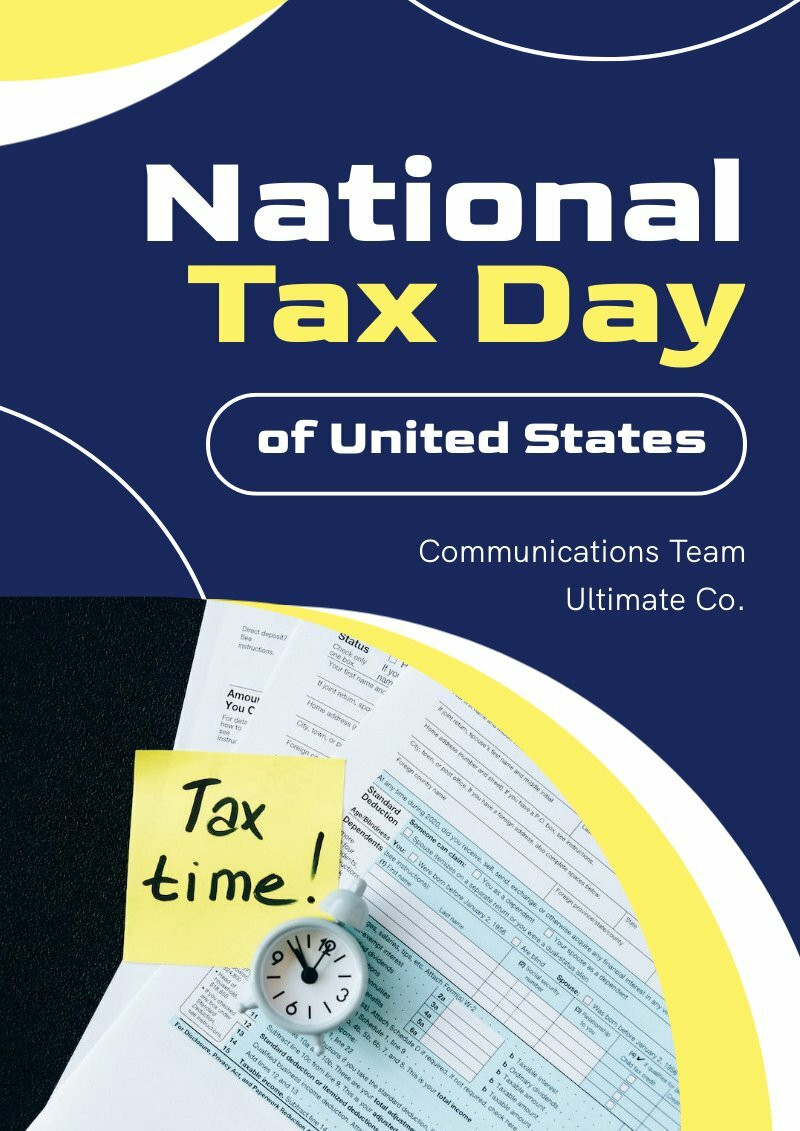
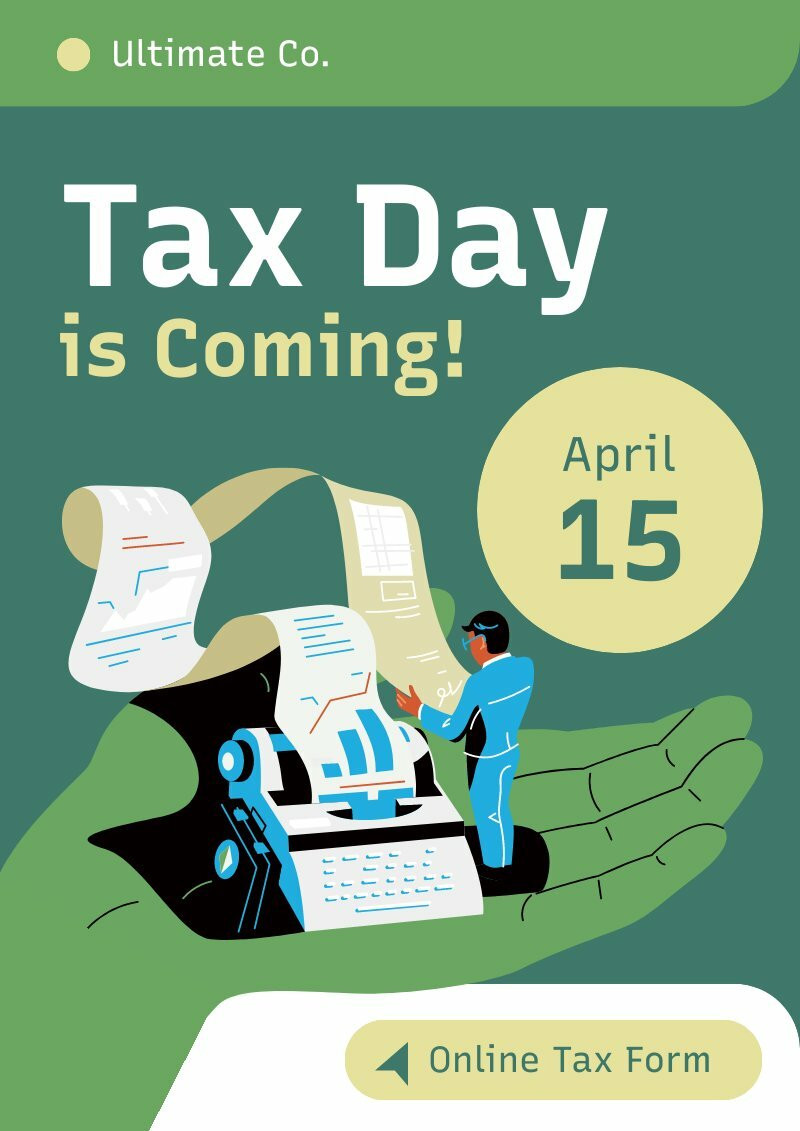
Tax Day Poster
Posters
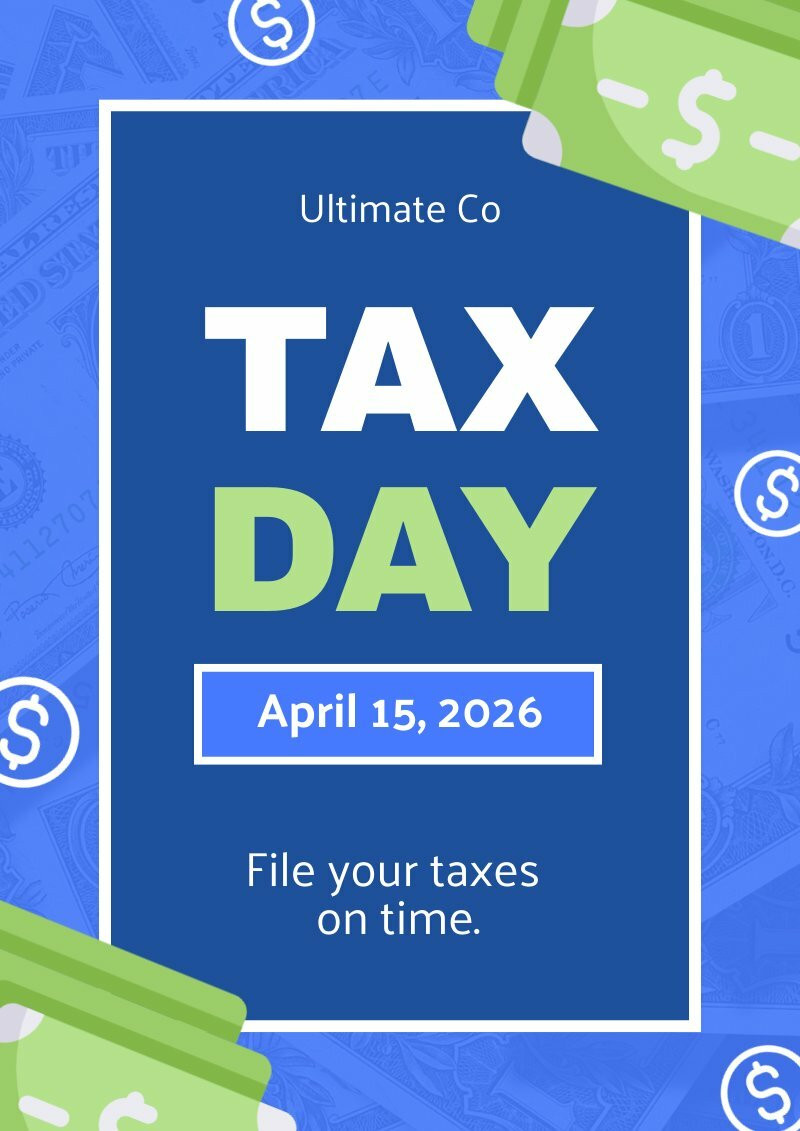
Tax Day Poster
 Posters
Last Day to File Taxes Poster
Posters
Last Day to File Taxes Poster
 Posters
Women’s Day Poster
Posters
Women’s Day Poster
 Posters
Last Day to Do Taxes Poster
Posters
Last Day to Do Taxes Poster
 Posters
US Tax Day
Posters
US Tax Day
 Posters
World Water Day Poster
Posters
World Water Day Poster
 Posters
Good Friday Service Poster
Posters
Good Friday Service Poster
 Posters
Simple Team Appreciation Poster
Posters
Simple Team Appreciation Poster
 Posters
Employee Recognition Day Poster
Posters
Employee Recognition Day Poster
 Posters
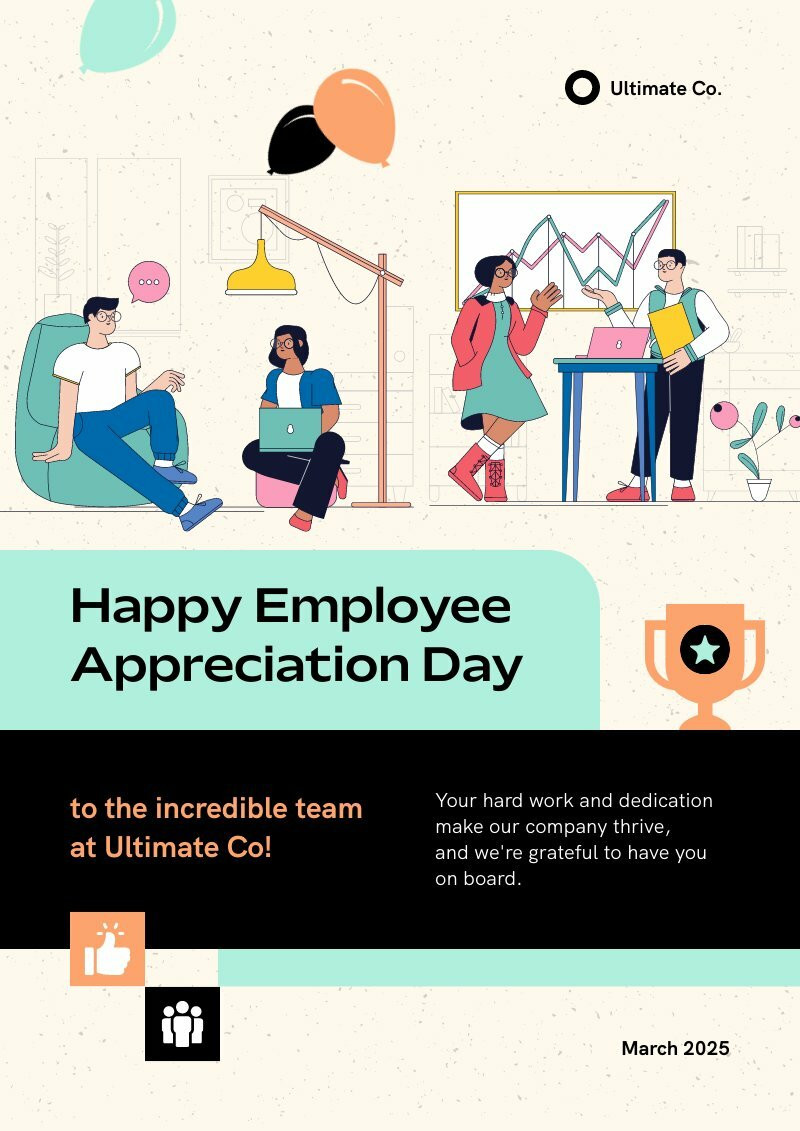
Employee Appreciation Day Poster
Posters
Employee Appreciation Day Poster
 Posters
Tax Day Holiday
Posters
Tax Day Holiday
 Posters
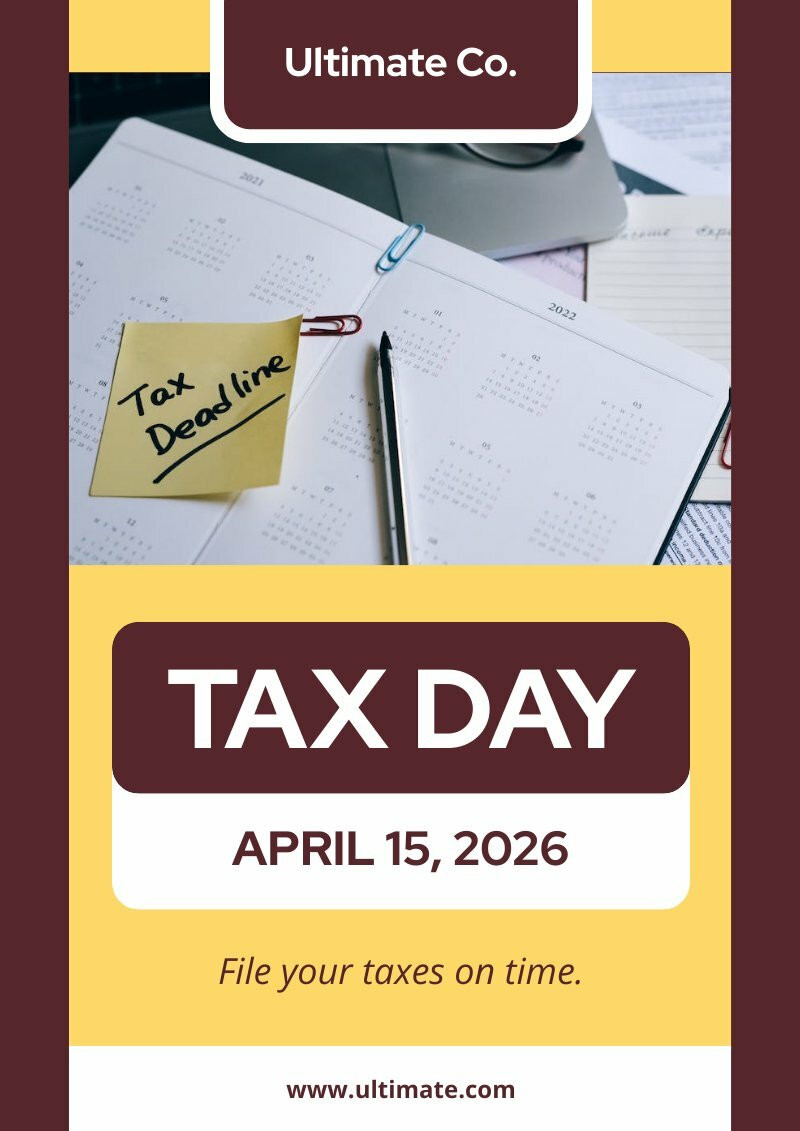
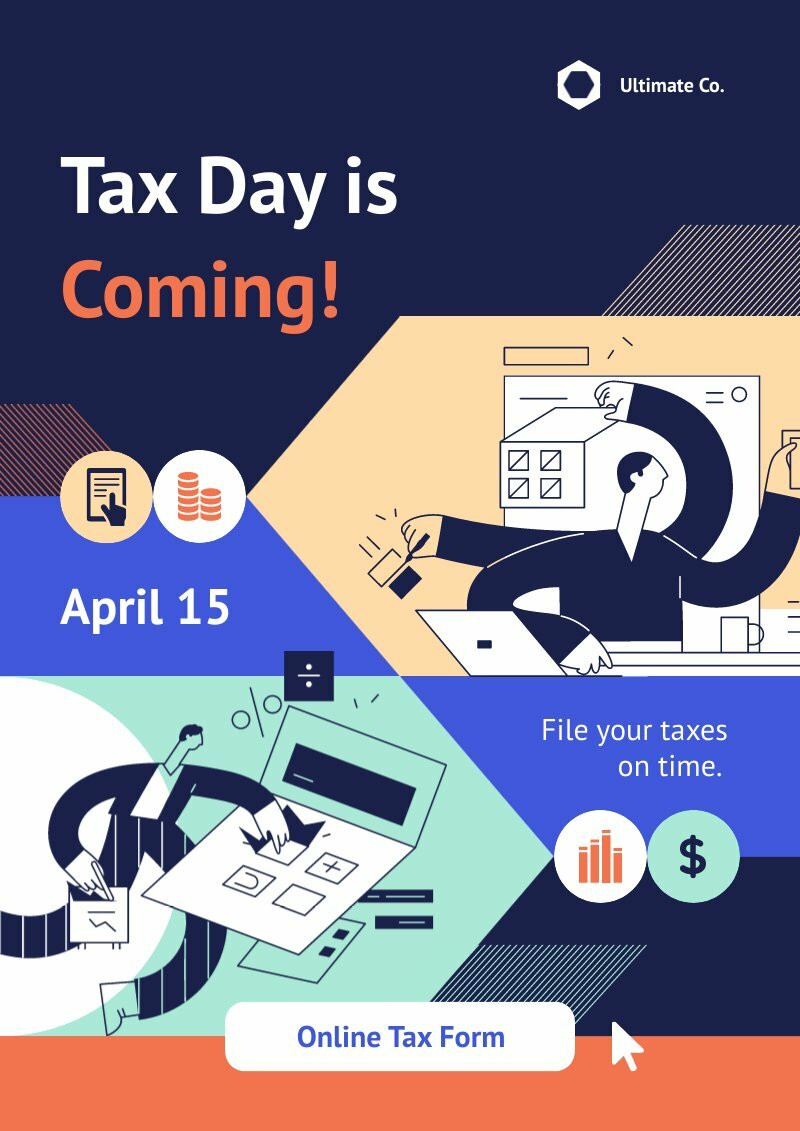
Tax Day Deadline Poster
Posters
Tax Day Deadline Poster