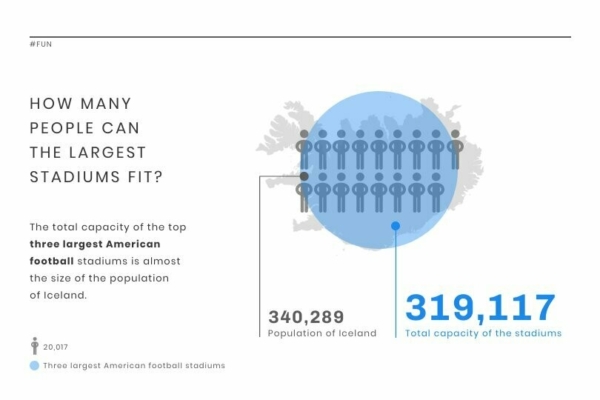
Stadium Size
Posters · Fact
Edit for freeYou'll be asked to log in or sign up for a free Piktochart account first.
A stadium-size news visualization template displays the capacity of a particular sports stadium.The use of icons is helpful in showing the number of gatherings a stadium can hold.You can even compare the capacity of the stadium with the use of these icons.
Available File Type
Customization
100% customizable
Tags
Template Details
Add your data and use the template as per your requirement by downloading it in PNG or PDF.
More Templates Like This
 Posters
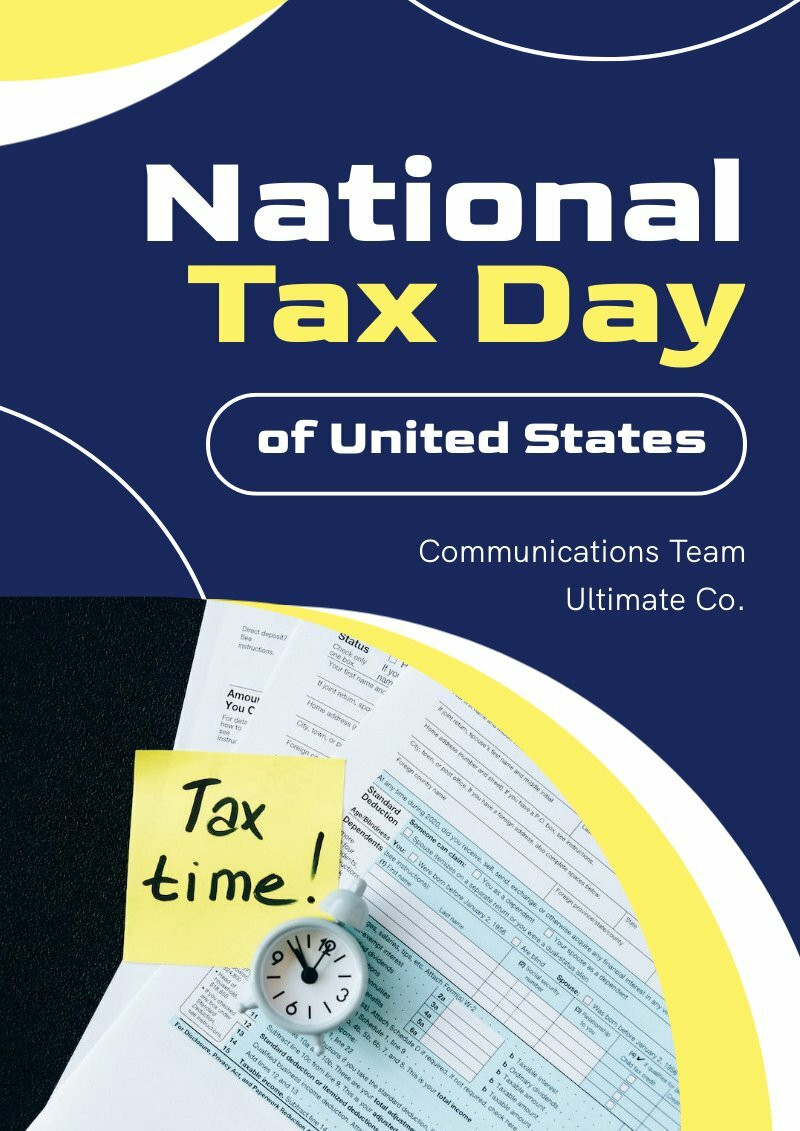
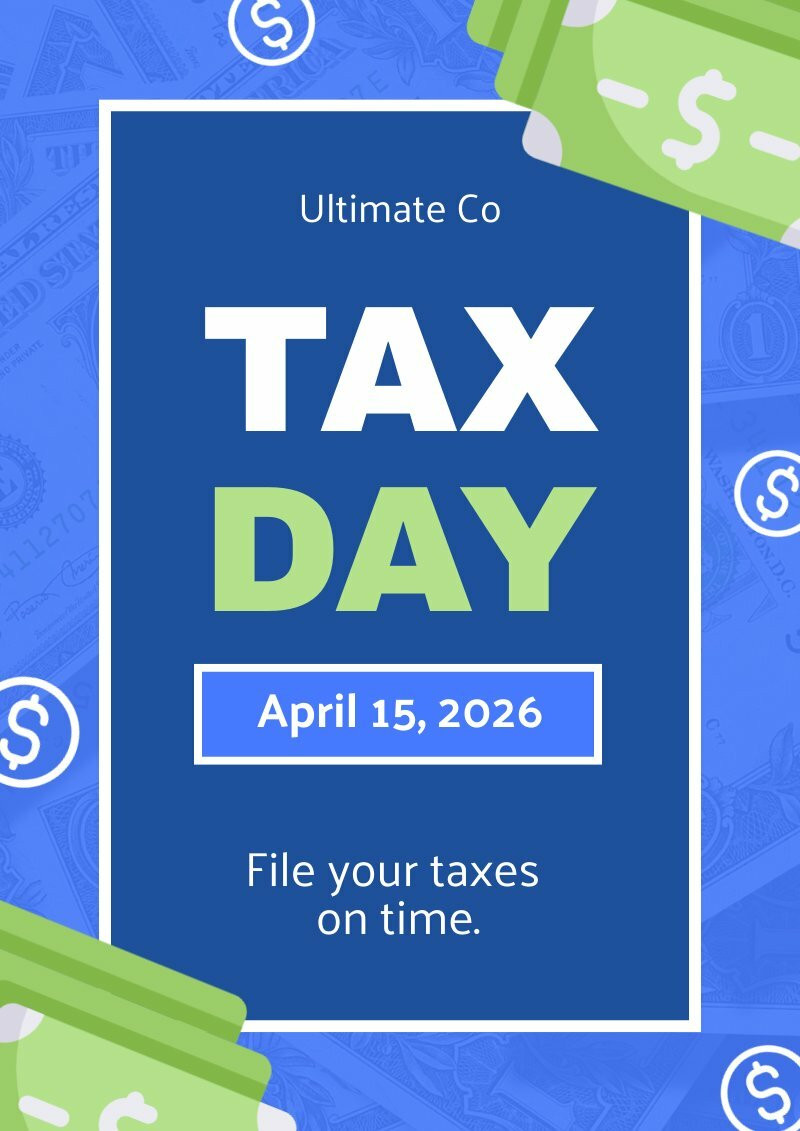
Tax Day Poster
Posters
Tax Day Poster
 Posters
Last Day to File Taxes Poster
Posters
Last Day to File Taxes Poster
 Posters
Women’s Day Poster
Posters
Women’s Day Poster
 Posters
Last Day to Do Taxes Poster
Posters
Last Day to Do Taxes Poster
 Posters
US Tax Day
Posters
US Tax Day
 Posters
World Water Day Poster
Posters
World Water Day Poster
 Posters
Good Friday Service Poster
Posters
Good Friday Service Poster
 Posters
Simple Team Appreciation Poster
Posters
Simple Team Appreciation Poster
 Posters
Employee Recognition Day Poster
Posters
Employee Recognition Day Poster
 Posters
Employee Appreciation Day Poster
Posters
Employee Appreciation Day Poster
 Posters
Tax Day Holiday
Posters
Tax Day Holiday
 Posters
Tax Day Deadline Poster
Posters
Tax Day Deadline Poster