Professional Reports Made Easy with Free Report Maker
Craft stunning, professional reports online effortlessly, even without any design experience. Our free report maker empowers you to create various reports – from monthly progress updates and HR dashboards to comprehensive sales and marketing analyses.


Piktochart is used by 14 million business professionals worldwide


Free online report maker
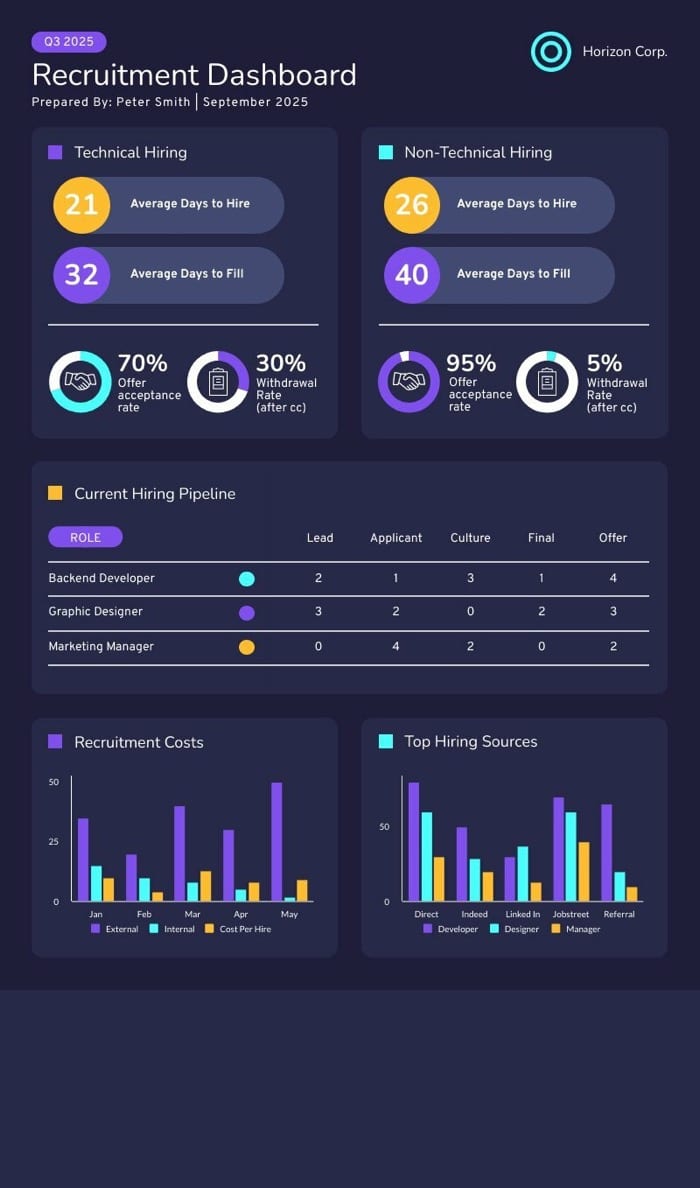
Professional Report Templates, Easy to Customize
Create compelling reports in just a few clicks using Piktochart’s diverse range of free, professional templates. Whether it’s monthly summaries, marketing analytics, or HR dashboards, Piktochart’s report maker has you covered.
Experience the ease of report design with our user-friendly drag-and-drop editor, an extensive library of stock photos, and various design elements. Download your reports in formats like PDF, PNG, or PowerPoint or share it online.
Browse report templates here
Transform data into meaningful stories
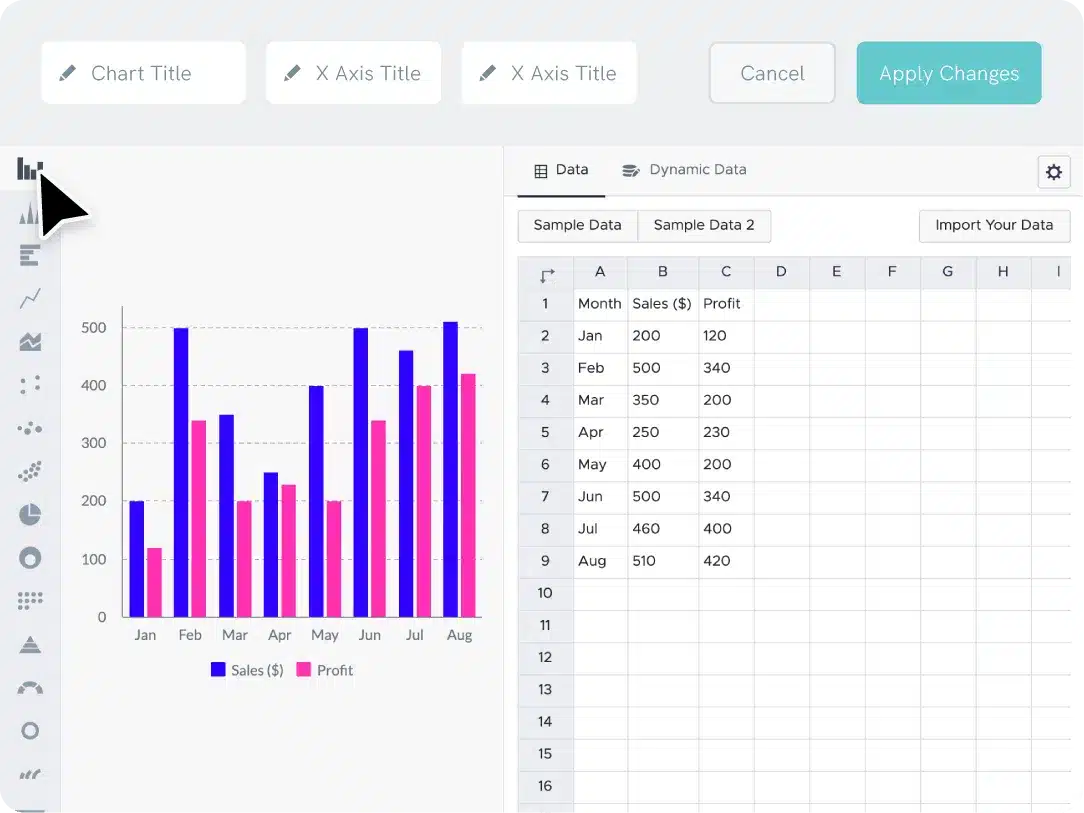
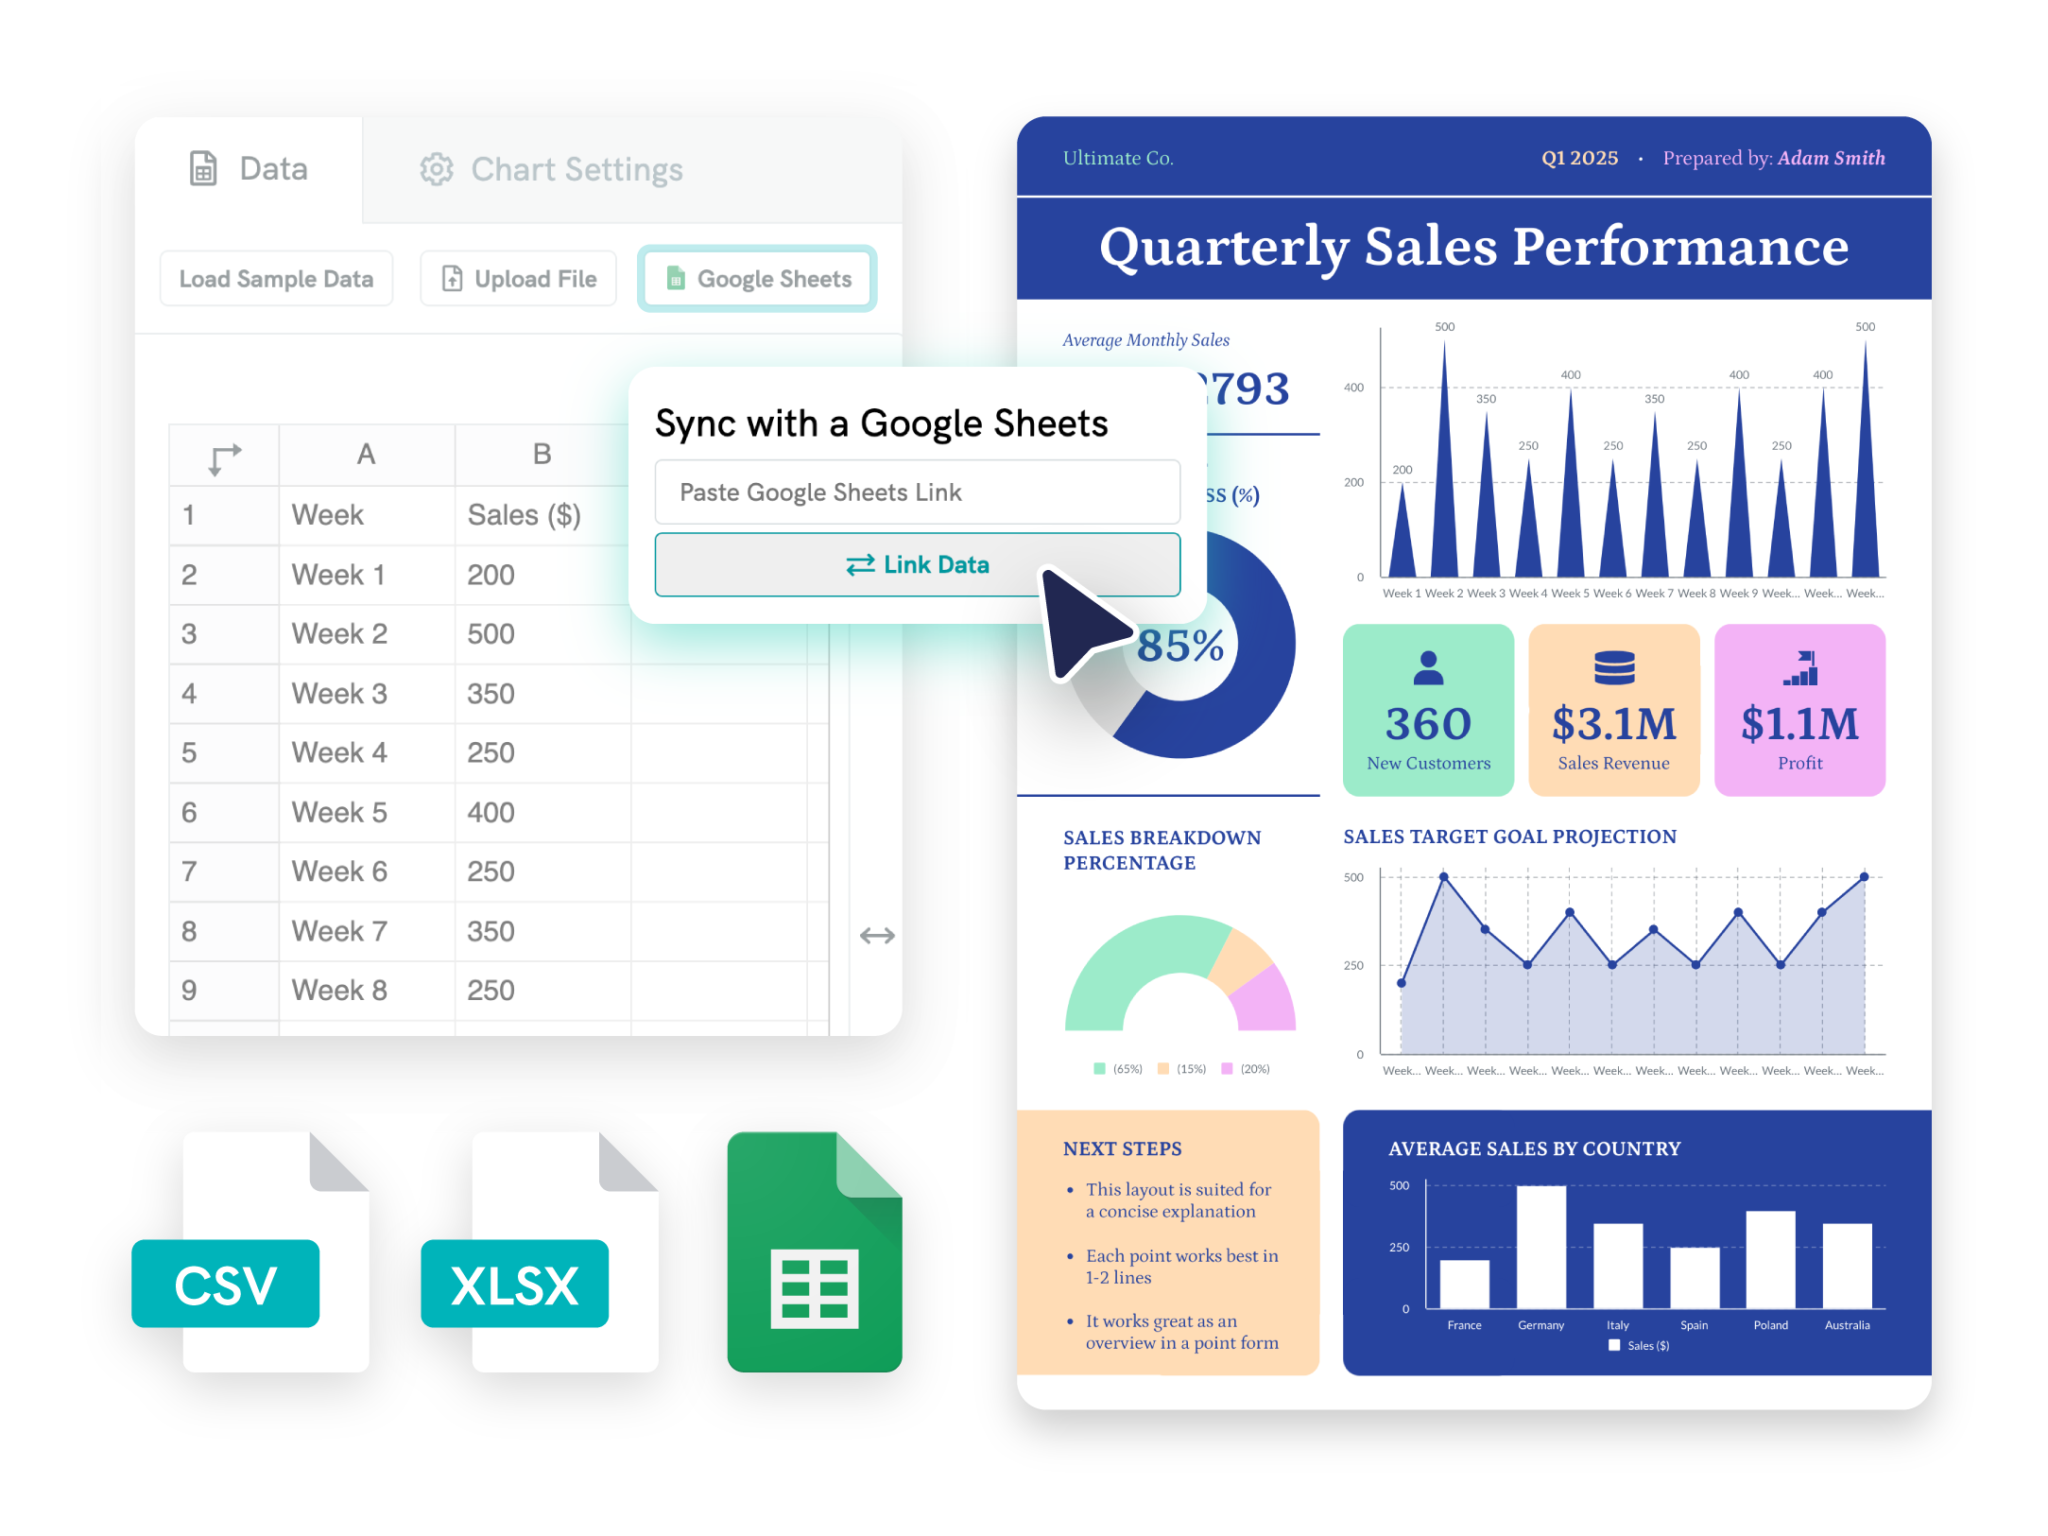
Revolutionize Your Reporting
Transform intricate data into captivating reports effortlessly with our report maker. Seamlessly integrate Excel files or Google spreadsheets into Piktochart’s report maker. This integration not only simplifies the creation of dynamic graphs but also ensures they refresh automatically with data updates.
Sign up at no cost and embark on creating your online report today. Our platform is designed to cater to both beginners and professionals.
Check out our graph tool
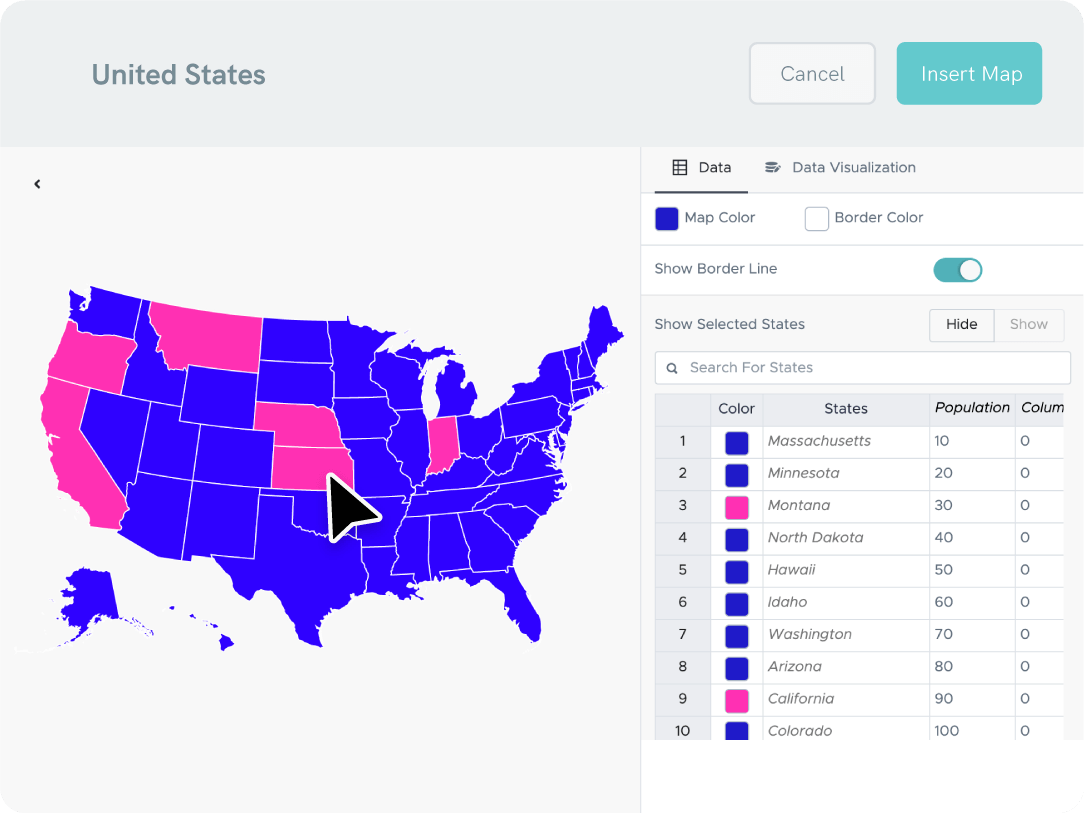
Chloropleth features in a free online report maker
Effortlessly Compare Geographical and Demographic Data
No advanced data visualization skills? No problem!
Whether you’re analyzing market trends, demographic shifts, or employee distributions, our tool simplifies the visualization of complex data across various geographies and populations. Unleash the power of effective data comparison with Piktochart’s user-friendly interface.
Make your own report
Create branded reports
Customize Your Report to Your Brand in Seconds
Simply drag and drop your logo or website screenshot, and our tool auto-magically extracts your brand colors.
Want to incorporate your company’s fonts into your digital reports? Absolutely possible.
With easy access to your custom color palette and uploaded fonts in the editor, crafting brand-aligned reports is effortless.
Learn more about Brand AssetsPeople use Piktochart’s report maker to:

Marketers
- Visualize marketing campaign results, customer demographics, and market trends, facilitating data-driven decision-making.
- Engaging, easy-to-understand reports for clients, showcasing campaign performance, ROI, and key marketing metrics.
- Identify emerging trends and forecasting future market movements.

HR and Learning and Development Reports
- Highlight progress, identify areas for improvement, and facilitate effective performance reviews.
- Visually represent the impact and effectiveness of training programs.
- Compile and interpret data on workforce diversity, employee satisfaction, and organizational culture.

NGOs and Government Organizations
- Illustrate impact on communities by showcasing progress on projects, beneficiary stories, and fund utilization, essential for donor reports and stakeholder updates.
- Reports on donation usage, program effectiveness, and organizational financial health.
- Analyze program data, helping to assess effectiveness, identify areas for improvement, and inform future project planning and resource allocation.

Researchers
- Transform complex datasets into clear, comprehensible visuals, aiding in the presentation of research findings.
- Easy sharing and editing of reports, essential for multi-author studies and publications.
- Prepare reports for academic journals or conferences, aligning with publication standards.
How to Create Reports in 3 Steps
1. Select a report template
Choose from pre-made report templates designed by professionals and change the design elements to create a stunning report. Creating reports have never been easier with no design experience required.
2. Customize to create beautiful reports
Upload your own images or drag and drop from the free stock photos available within the Piktochart online report maker. Create a report in minutes.
3. Download or share it online
Share your report online via a direct link, upload it to your website, publish it on social media, or download it as PDF or PNG and print it.
Edit Free Report Templates and Customize


Ready to create an engaging report?
Join more than 14 million people who already use Piktochart to craft amazing visual stories.