Design
25 Green Color Palette Combinations (With Hexes and Name Codes)
If you’re looking for design inspiration, nature’s green palette is an endless source of wonder. Think of the tender shoots of springtime, the deep hues of a rainforest canopy, or the subtle sage of desert succulents. Green is commonly used in branding, especially for companies who want to convey freshness, sustainability, health, growth, or financial themes. […]
Visuals Hub
10 Exceptional Newsletter Examples to Elevate your Email Marketing Strategy
Visuals Hub
21 Flowchart Templates for Word, PowerPoint, and Google Slides

Human Resources (HR)
75 Best Work Anniversary Wishes for Coworkers and Colleagues

Artificial Intelligence
Top 10 Best AI Graphic Design Tools for 2024
Visuals Hub
A 2024 Guide to White Papers (with Templates and Examples)
Reports
10 Best Sales Report Templates for Tracking Revenue, KPIs & Growth

Data Visualization
12 Graphic Organizer Examples for Teachers and Students

Design
25 Green Color Palette Combinations (With Hexes and Name Codes)

Design
How to Create a Professional Business Letterhead (With Tips, Templates and Examples)

Human Resources (HR)
9 Strategies for Effectively Communicating Change to Employees (With Examples)
Reports
10 Types of HR Reports (With Templates and Examples)
Reports
7 Captivating Report Design Ideas And Tips (With Templates and Examples)

Marketing
High Ticket Affiliate Marketing: 6 Content Strategies that Increase Your Conversions

Artificial Intelligence
9 AI Logo Generators for Small Businesses in 2024

Artificial Intelligence
8 AI Report Generators in 2024

Artificial Intelligence
5 Best Video Generators in 2024

Artificial Intelligence
8 Best AI Banner Generators in 2024

Data Visualization
5 Best AI Chart And Graph Makers in 2024 (Free and Paid)

Uncategorized
10 Best AI Grammar Checker Tools for 2024

Human Resources (HR)
6 Steps to Develop an Employee Engagement Plan (With Free Templates)

Communications
11 Ways To Improve Employee Engagement

Uncategorized
10 Best Brochure Design Software for Stunning Designs in 2024

Design
Design Fusion: The 9 Vibrant Graphic Design Trends to Watch in 2024

Uncategorized
9 Best Poster Making Software In 2024

Uncategorized
9 Best Flyer Design Software Programs

Marketing
8 Viral Images Created By AI

Communications
What Jobs Will AI Replace (How to Prepare?)

Marketing
Gen AI’s Environmental Ledger: A Closer Look at the Carbon Footprint of ChatGPT

Marketing
9 Best AI Text Generators

Design
14 Best AI Image Generators In 2024 (Free And Paid Options)

Consulting
Competitor Insights 101: The Best Template for Mapping Industry Players
Consulting
Understanding TOWS: A Deeper Dive into Advanced SWOT Analysis
Educators
The Ultimate Guide to Flashcards: Boosting Memory and Learning Efficiency
Students
From Chaos to Clarity: Streamlining Your Student Life with a Schedule Builder
Data Visualization
Step-by-Step Guide to Creating Your First Custom Map

Human Resources (HR)
Attract Top Talent: 20+ Creative Job Posting Templates for 2023

Communications
What is Internal Communications?
Communications
What Is Visual Storytelling? How to Engage and Inspire Audiences
Educators
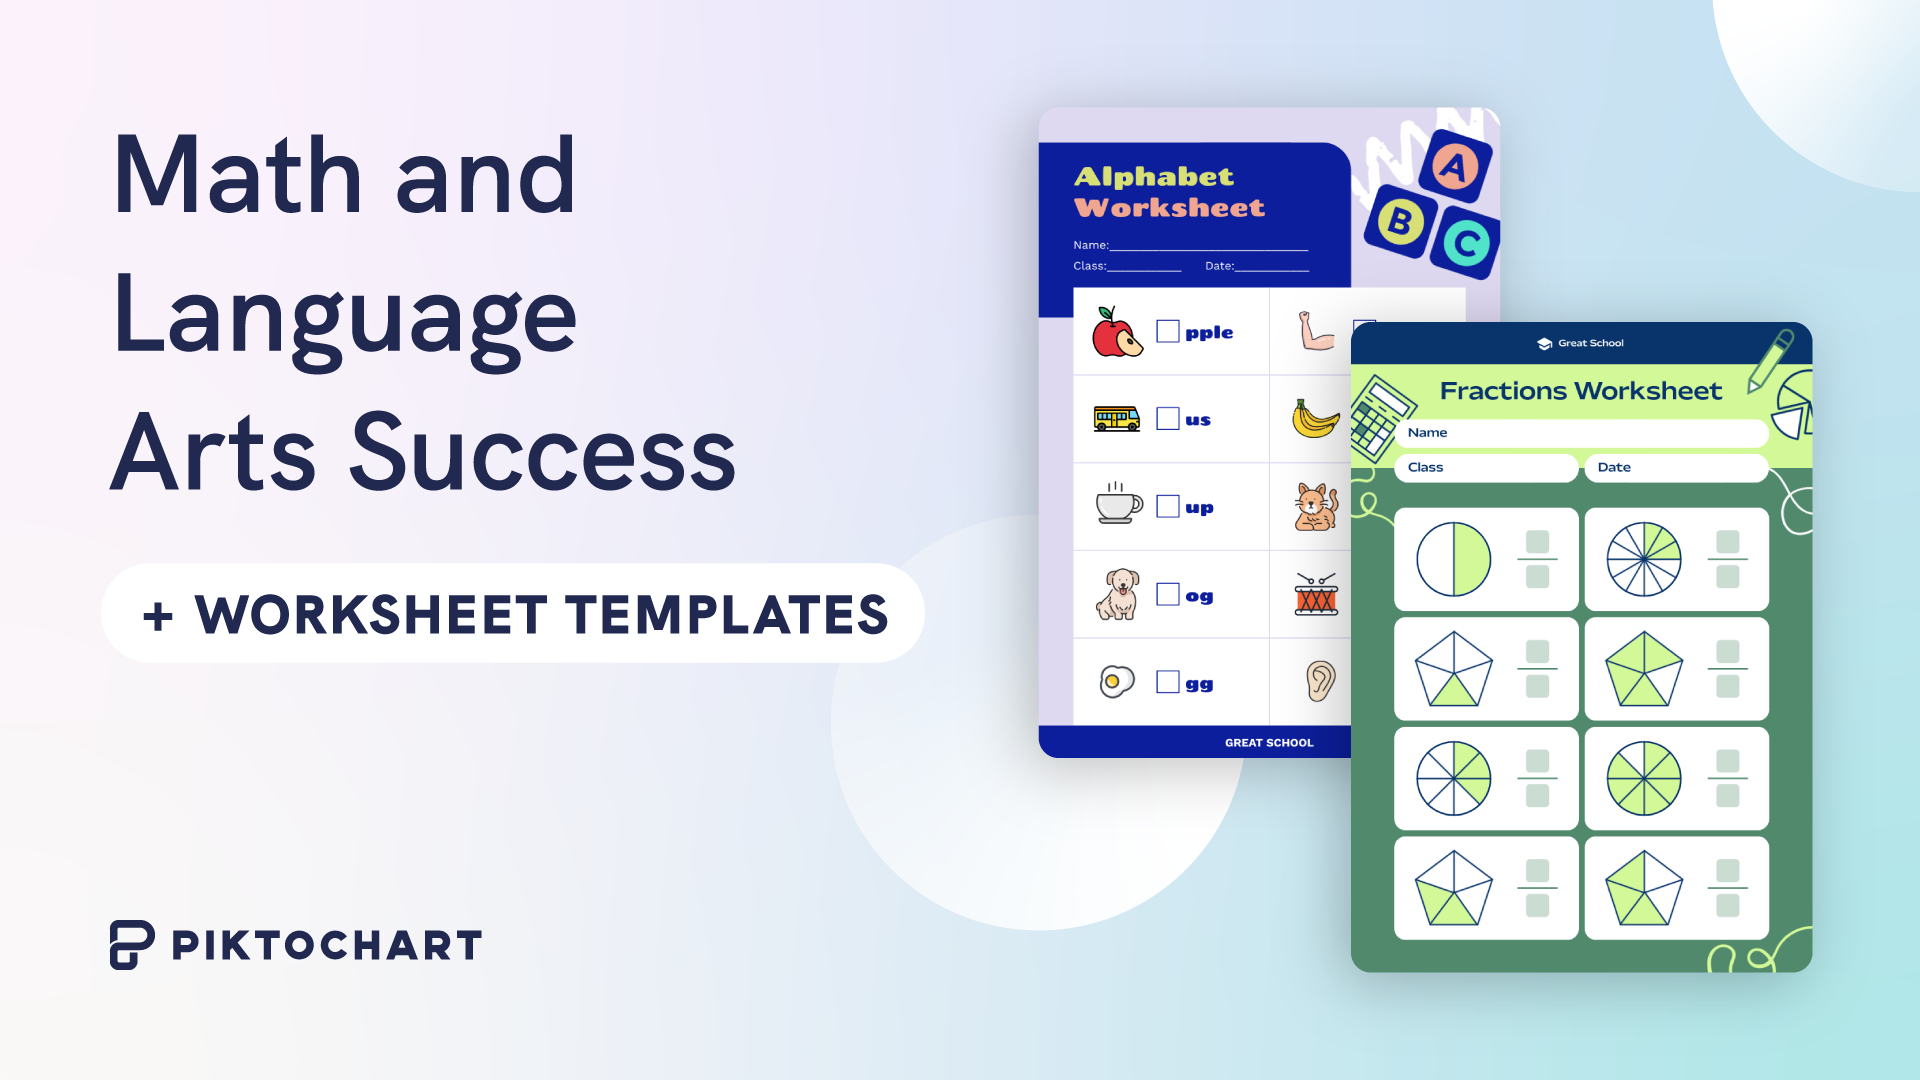
Math and Language Arts Success Starts Here: 20+ Free Customizable Worksheet Templates
Branding
The Evolution of Five Iconic Brand Logos (Amazon, Apple, Google, Nike, Starbucks) and Free Logo Templates

Human Resources (HR)
A 2023 Guide to Training And Development (+ Steps, Tips & Templates)
Communications
Promoting Mental Health Awareness in the Workplace: The Power of Thoughtful Posters + Templates
Reports
What is a Business Report? (Examples, Tips and How to Make One)
Human Resources (HR)
How to Successfully Execute an Employee Engagement Survey in 2023
Human Resources (HR)
Empowering Your Workforce: A Comprehensive Guide to Implementing Employee Counseling Programs

Visuals Hub
Revamp Your Screens: The 5 Coolest Wallpaper Design Ideas of 2023

Visuals Hub
Boost Your Virtual Meetings: Top Zoom Backgrounds for 2023

Students
Resume with No Experience

Human Resources (HR)
Transforming Work Culture with Innovative Workplace Wellness Programs: Strategies and Insights
Human Resources (HR)
Building Employee Value Proposition with Insider Insights from HR Leader

Design
Mastering the Craft: Presentation Design Strategies From a Pro

Human Resources (HR)
Creating the Perfect Employee Handbook: A Step-by-Step Guide
Visuals Hub
Maximize Impact with 25+ Free Customizable, Printable Certificate Templates

Human Resources (HR)
Navigating Remote Work: Expert Tips for Managing Remote Teams Effectively

Leadership
Leadership Personified: Discover 11 Types of Effective Leadership Styles

Visuals Hub
Printed Marketing Materials: Flyer, Brochure, or Pamphlet – Which One Is Right for You?
Human Resources (HR)
Essential Guide to Employee Onboarding: Maximizing Efficiency with Piktochart
Visuals Hub
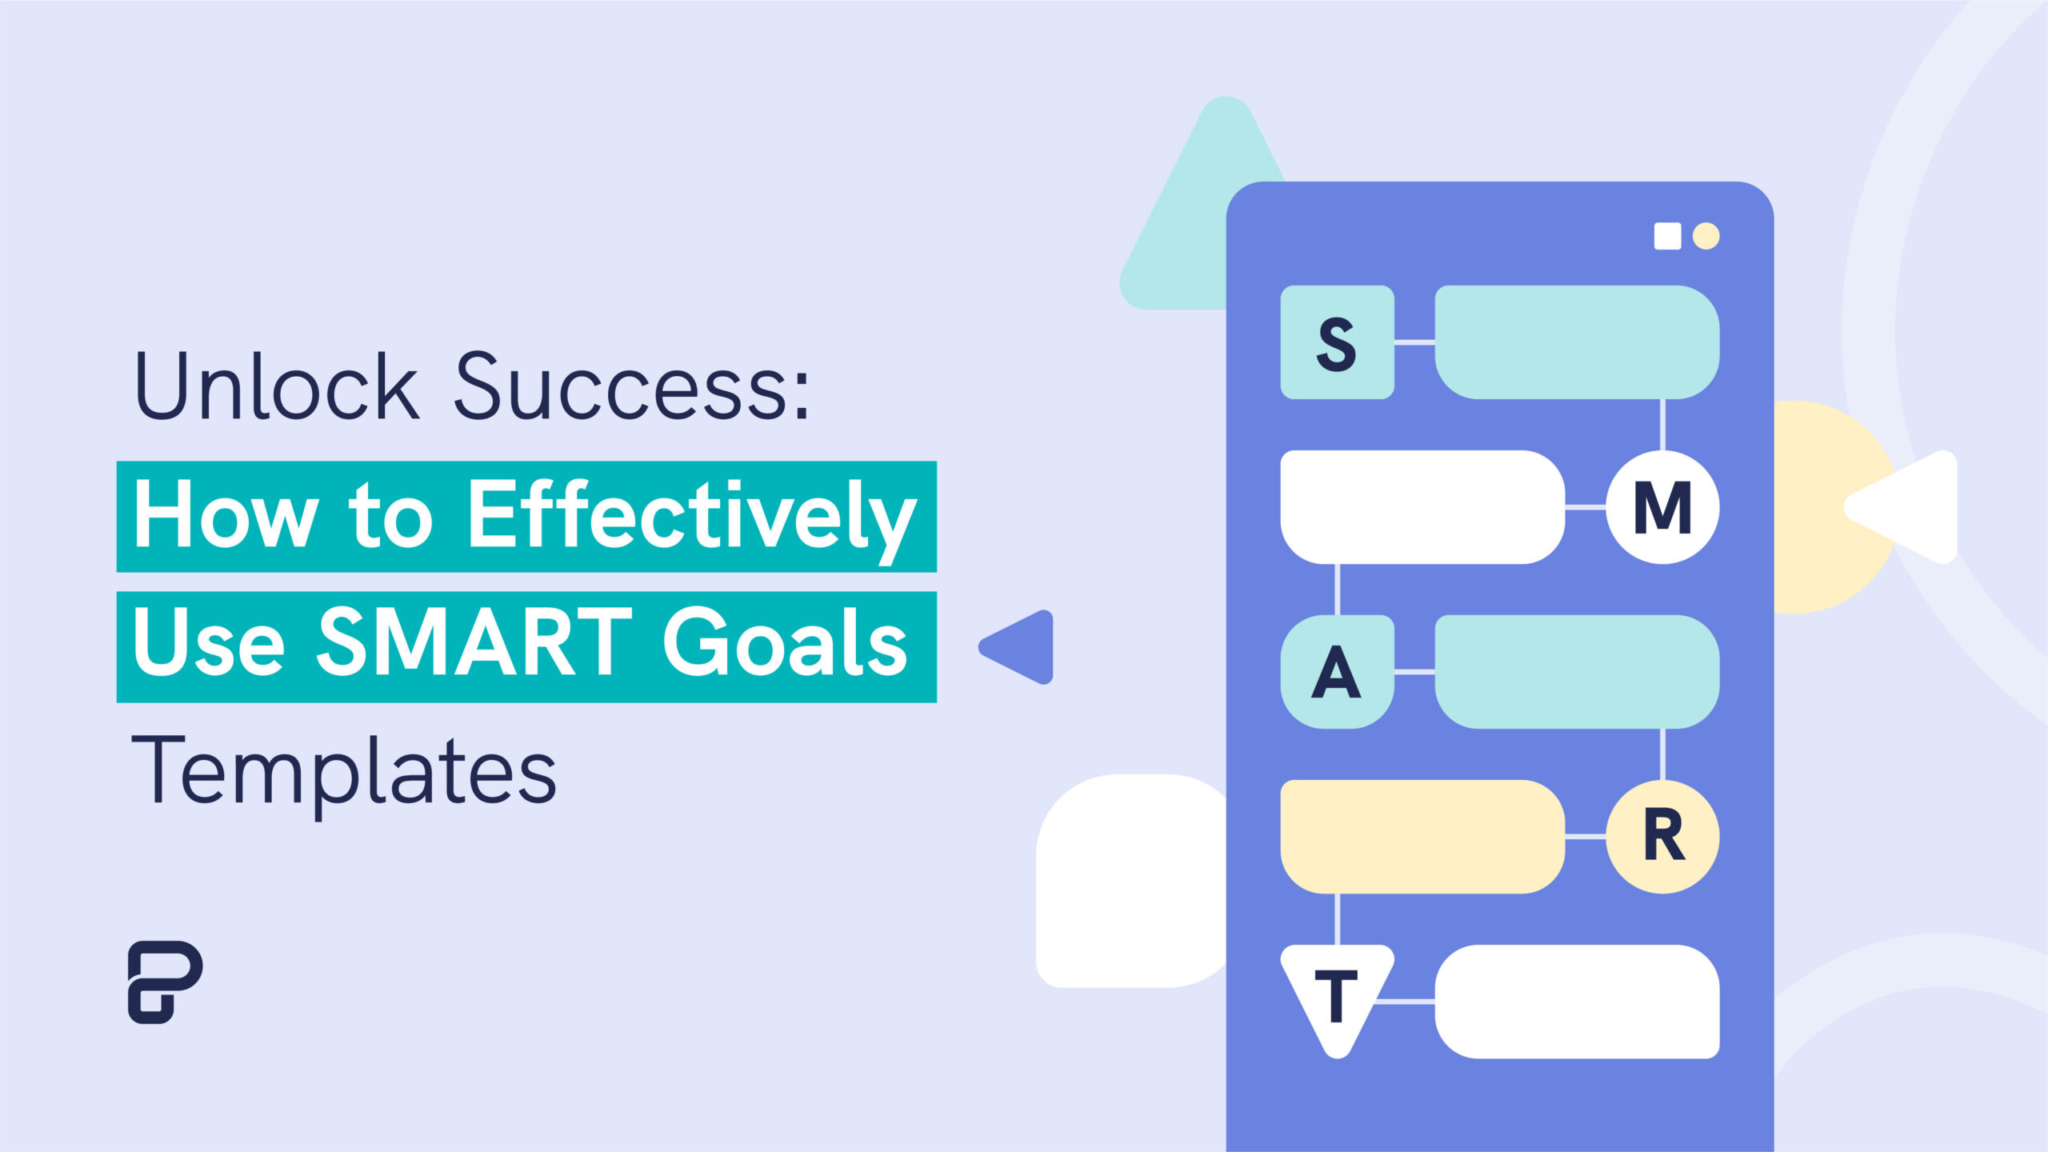
Unlock Success: How to Effectively Use SMART Goals Templates

Visuals Hub


